Korea's pension bill sorts 11.6 million workers into a pay ladder. Top to bottom, 2.3 times.
Every employer is billed 9% of a worker's pay for the national pension, up to a ceiling. Rank Korea's 41 biggest industries by that bill per head and imaging-equipment plants sit 2.3 times above employment agencies.
AI-assisted, human-reviewed sourcing. Figures are pulled programmatically from the official sources listed at the end of this article and checked by an editor before publication.
national pensionwageslabourindustrykorea
There is one number about a Korean worker that almost nobody games. Not the salary on the contract, not the figure on the tax return — the bill the employer gets from the national pension every month. It is 9% of the worker’s pay, half withheld from the paycheque and half paid by the company, and it lands for 11.6 million people at 554,570 workplaces. Add it up by industry and you get something an income statement never shows: a pay ladder for the whole workforce.
The ladder
For every active workplace we took the month’s pension bill and divided it by the number of subscribers, then rolled it up by industry, weighting each workplace by how many people it employs. The result is the average monthly pension bill per worker — which, because the contribution is a flat 9% of pay, rises and falls with what the industry pays.
| Industry | Workers | Bill per worker (₩/mo) | |
|---|---|---|---|
| 1 | Imaging-equipment manufacturing | 155,224 | 581,799 |
| 2 | Truck & special-vehicle manufacturing | 131,336 | 570,432 |
| 3 | Domestic banks | 167,704 | 520,281 |
| 4 | Solar power generation | 63,294 | 517,831 |
| 5 | Computer manufacturing | 69,124 | 516,549 |
| 6 | Other financial investment | 54,912 | 505,170 |
| … | |||
| 38 | Korean restaurants | 59,451 | 278,909 |
| 39 | Supermarkets | 51,945 | 266,276 |
| 40 | Freight packing & inspection | 74,992 | 252,333 |
| 41 | Employment placement agencies | 83,148 | 249,052 |
The industry at the top of the ladder is billed 2.3 times what the industry at the bottom is billed for each worker. At one end, factories that build displays, trucks, computers and the banks that finance them; at the other, the businesses that place, feed, guard and clean — restaurants, supermarkets, security firms, staffing agencies. None of this will surprise anyone who works. What it does is put a measured number on the gap, from a source no one fills in to look good.
Why the bill, and not a wage
It is tempting to divide the bill by 9% and print a salary. We do not, and the reason is in the data itself.
The contribution caps out. Above a monthly income ceiling — a little over six million won — a worker’s pension is figured as if they earned exactly the ceiling, no more. So the bill stops climbing even when pay keeps going. You can see the wall directly: no workplace where every worker is capped is billed more than 605,140 won a head, and that figure sits above the 573,300 that 9% of the ceiling alone would produce, because real bills also carry arrears and back-payments. Invert a number like that and you would be manufacturing a precision the figure does not carry.
So the bill ranks pay; it does not read it. It tells you an imaging-equipment worker is paid well above a supermarket worker, and by roughly how much — up to the point where the ceiling swallows the difference.
The ceiling hides the top
That ceiling is the quiet part of the story. The top of the ladder is not just high; it is pressed against a wall. In the industry at the very top — imaging-equipment manufacturing — 147,430 of its 155,224 workers, 95%, are already billed at or above the cap. Its 581,799 won a head is a floor, not a reading of the pay: the real figure runs past where this measure can follow. So the true distance between the top industry and the middle is larger than the 2.3x shows — the measurement runs out of room before the pay does, and the 2.3x is a lower bound. The compression is at the top, and it flatters no one at the bottom.
Incorporated versus not
One more cut the file allows. Split every workplace by whether it is an incorporated company or a sole proprietorship, and the gap is plain: incorporated workplaces are billed 370,340 won per worker, sole proprietorships 280,520. The 882,490 people working for an individual owner — the corner store, the single-clinic practice, the family workshop — sit a quarter below the 10.7 million who work for a company, on the one measure that does not care what anyone calls the job.
None of these are income-statement numbers. They are the people the income statements pay — sorted, for once, by the one bill that arrives whether the company wants it seen or not.
Data & Verification Notes
- Data as of
- Sources
- National Pension Service (Korea) — Workplace subscriber file (가입 사업장 내역), month of record 2026-06
- Cross-checks
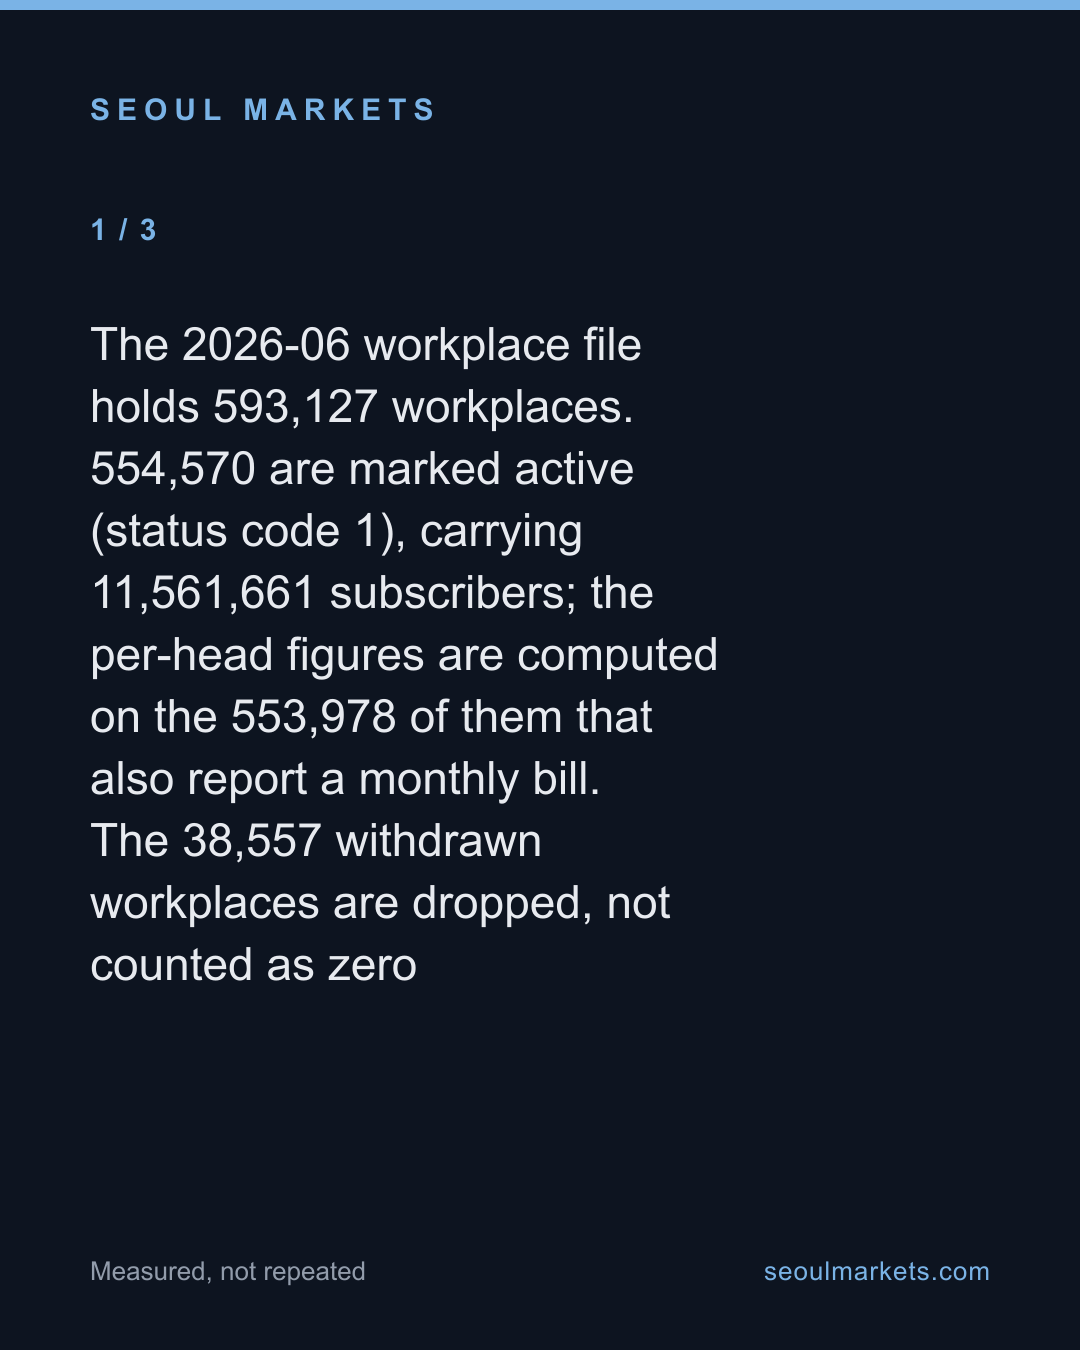
- The 2026-06 workplace file holds 593,127 workplaces. 554,570 are marked active (status code 1), carrying 11,561,661 subscribers; the per-head figures are computed on the 553,978 of them that also report a monthly bill. The 38,557 withdrawn workplaces are dropped, not counted as zero
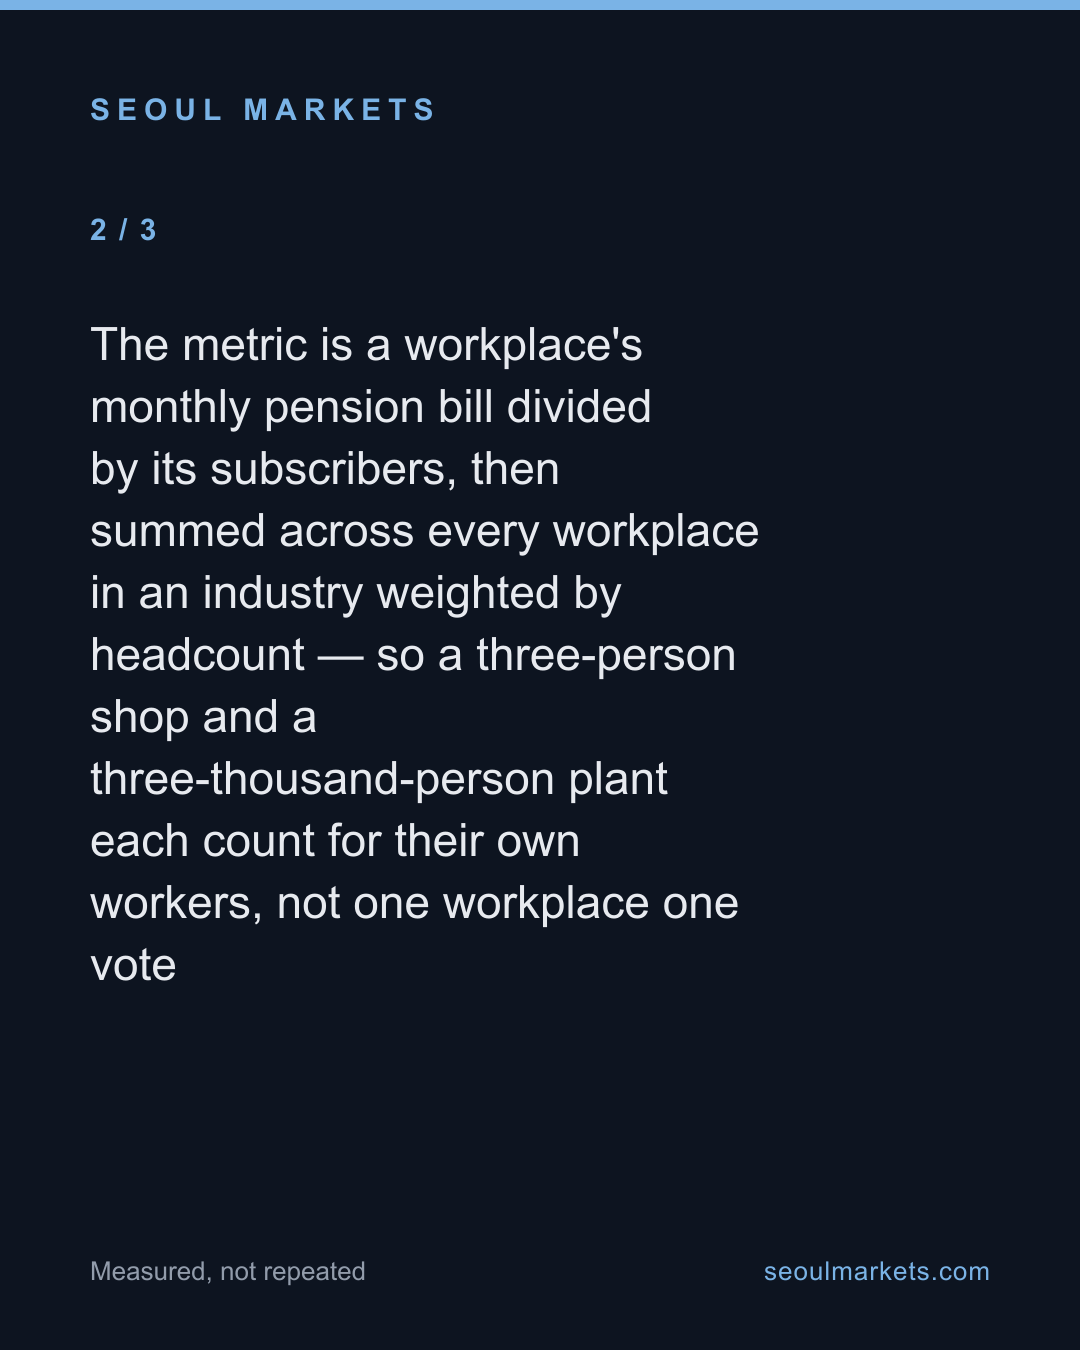
- The metric is a workplace's monthly pension bill divided by its subscribers, then summed across every workplace in an industry weighted by headcount — so a three-person shop and a three-thousand-person plant each count for their own workers, not one workplace one vote
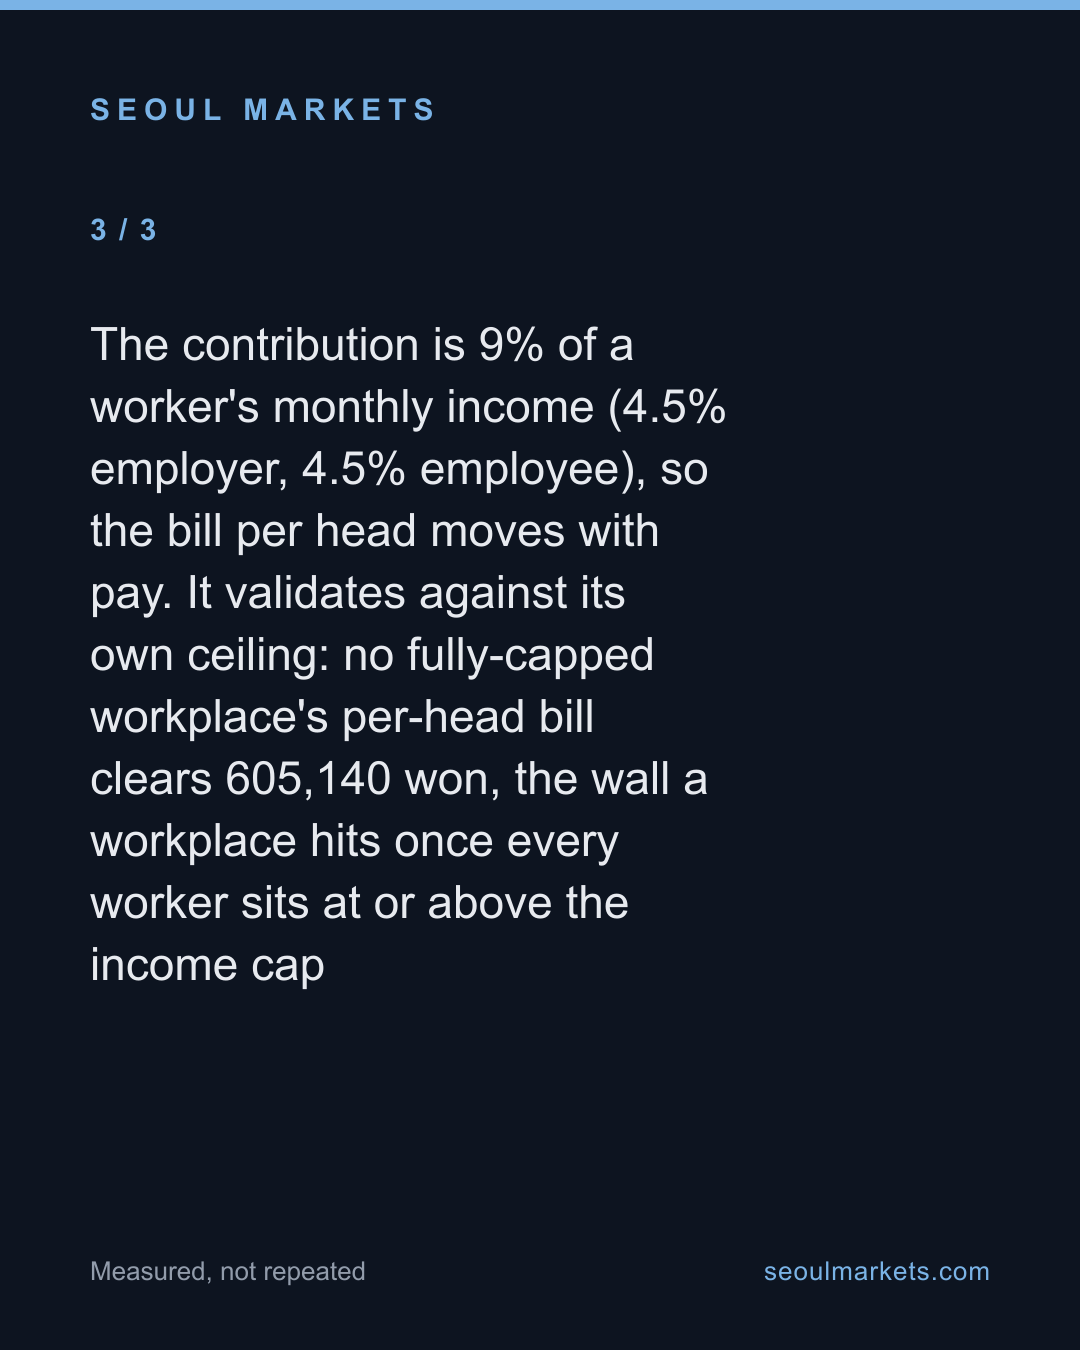
- The contribution is 9% of a worker's monthly income (4.5% employer, 4.5% employee), so the bill per head moves with pay. It validates against its own ceiling: no fully-capped workplace's per-head bill clears 605,140 won, the wall a workplace hits once every worker sits at or above the income cap
- An industry is ranked only where it employs at least 50,000 of the 11.6 million workers — 41 industries clear that bar — so no place on the ladder rests on a thin sample
- In the top-ranked industry, imaging-equipment manufacturing, 147,430 of its 155,224 workers — 95.0% — sit at workplaces billed at or above 573,300 won a head, the point where the income ceiling caps the contribution. Its 581,799 is therefore a floor the data cannot see past, and the 2.3x gap to the bottom is a lower bound, not the full distance
- The source file is Korean-Windows encoded (CP949/EUC-KR) and was decoded before any field was read
- Excluded figures
- Any conversion of the bill into a won salary. The bill carries arrears and back-payments — its fully-capped ceiling of 605,140 sits above the 573,300 that 9% of the current income cap alone would give — so inverting it to a precise wage would invent precision the data does not hold. This ranks pay; it does not read it
- Everything above the income ceiling. Two industries whose workers all clear the cap look identical; the ladder compresses at the top and cannot separate the highest-paid from the merely high
- The region breakdown. The file's province code mixes coding schemes — one province returns 128 workers where it should hold hundreds of thousands, and unmapped codes carry hundreds of thousands more — so no regional figure is reported here
- A catch-all bucket of 1.38 million workers at workplaces with no business-registration number, which is not an industry and is left out of the industry ranking
- Whether a worker is full- or part-time, and how weekly hours differ across industries. A low bill can be low pay or short hours; this data cannot tell the two apart
- Corrections
- — A re-verification against the source (8 August re-check) found the cross-check overstated the analysis set. 554,570 is the count of active workplaces (status 1), carrying 11,561,661 subscribers; the per-head bill figures are computed on the 553,978 of those that also report a monthly bill. The headline ratios and the incorporated/sole-proprietor figures are unchanged.
The full dataset behind these figures — every listed company, every row — is available to license. SeoulMarkets data for licence →
Not investment advice. SMarkets publishes data journalism for general information only. Nothing here is investment advice, a recommendation, or an offer to buy or sell any security — any investment you make is at your own risk and responsibility. Figures are derived from official public data sources and may be revised by the issuing agency. Verify independently before acting.
Take this away — 5 cards
The figures in this article, as images. Free to repost with the address on them.