Korean banks are up 6% since the KOSPI peaked. The index is down 31% because it is 60% semiconductors.
Of 160 tradeable Korea Exchange indices, twelve have risen since 22 June. Electronics is 60.1% of KOSPI market capitalisation, fell 38.7%, and dragged the benchmark with it. Banks, pharma and staples never joined the fall.
AI-assisted, human-reviewed sourcing. Figures are pulled programmatically from the official sources listed at the end of this article and checked by an editor before publication.
kospisemiconductorssector rotationmarket concentrationkorean equities
The KOSPI fell 31.3% between 22 June and 3 August. That is the number in every summary, and it invites a picture of a broad Korean sell-off.
Here is what actually happened, across all 160 tradeable indices the Korea Exchange publishes.
| Since 22 June | |
|---|---|
| KRX SK Hynix index (1 constituent) | −46.3% |
| KRX K-AI Semiconductor Top 2+ (10) | −42.4% |
| KOSPI 200 Information Technology (16) | −41.8% |
| KRX Semiconductor (35) | −40.5% |
| Electronics (69) | −38.7% |
| KOSPI | −31.3% |
| Median of all 160 indices | −19.3% |
| Utilities (11) | +0.1% |
| Transport and warehousing (24) | +0.2% |
| Food and tobacco (37) | +3.1% |
| KRX Consumer Staples (35) | +3.6% |
| Pharmaceuticals (49) | +5.7% |
| KRX Banks (10) | +6.1% |
Twelve of 160 indices rose. The median index fell 19.3% — considerably less than the headline benchmark.
Why the benchmark fell more than the median index
Because the benchmark is not an average of sectors. It is weighted by market value, and one sector is most of the market value.
On 3 August, listed market capitalisation:
- Electronics: 3,106tn won — 60.1% of the KOSPI
- KRX Semiconductor: 2,630tn — 50.9%
- KRX Banks: 207tn — 4.0%
- Pharmaceuticals: 53tn — 1.0%
Electronics fell 38.7%. Banks rose 6.1%. The index followed electronics, because in market-value terms the index very nearly is electronics.
A useful way to hold it: semiconductors are half of the Korean stock market by value, and ten banks are one twenty-fifth. When people say “Korean equities”, this is the ratio they are describing without knowing it.
The sectors did not peak on the same day
“The market peaked on 22 June” is true of the benchmark and false of most of what is in it.
| Index | 2026 peak | On | Since peak |
|---|---|---|---|
| KRX Banks | 1,799.65 | 20 February | −9.8% |
| Pharmaceuticals | 19,771.30 | 24 February | −23.9% |
| Food and tobacco | 5,298.60 | 14 May | −11.5% |
| Electronics | 161,250.90 | 22 June | −38.7% |
| KRX Semiconductor | 19,708.74 | 22 June | −40.5% |
| KOSPI | 9,114.55 | 22 June | −31.3% |
Banks topped out four months before the index and have given back less than a tenth. Pharma topped out in February and is the one sector on this list that is down 13.0% for the year. Semiconductors ran until 22 June and took the benchmark with them, up and then down.
The round trip nobody mentions
Set the drawdown against where these sectors started the year.
| Index | End 2025 | 2026 peak | Now | Year to date |
|---|---|---|---|---|
| Electronics | 49,778.71 | 161,250.90 (+224%) | 98,888.21 | +98.7% |
| KRX Semiconductor | 6,422.88 | 19,708.74 (+207%) | 11,726.89 | +82.6% |
| KRX Banks | 1,303.78 | 1,799.65 (+38%) | 1,623.13 | +24.5% |
| Pharmaceuticals | 17,285.72 | 19,771.30 (+14%) | 15,037.27 | −13.0% |
Korean electronics tripled in under six months, then gave back a third of the move, and is still up 99% on the year. Describing that as a crash is as incomplete as describing it as a boom.
The genuinely poor performer of 2026 is pharmaceuticals, which never participated, peaked in February, and is the only major sector in the red for the year. It does not appear in the drawdown coverage at all, because it did not fall from 22 June — it fell from 24 February, quietly, while the index was still climbing.
What we are not saying
We do not know why semiconductors fell or why banks did not, and this dataset cannot tell us. Prices and market capitalisation are what the exchange publishes; motive is not.
We also are not saying the concentration is dangerous. We are saying it is measurable, and that it is 60.1%. Anyone reading a Korean index number — up or down — is mostly reading one industry, and that is worth knowing before the next move, in either direction.
Data & Verification Notes
- Data as of
- Sources
- Financial Services Commission (Korea) — Market Index Information Open API — getStockMarketIndex (daily close and listed market capitalisation for 168 index series)
- Cross-checks
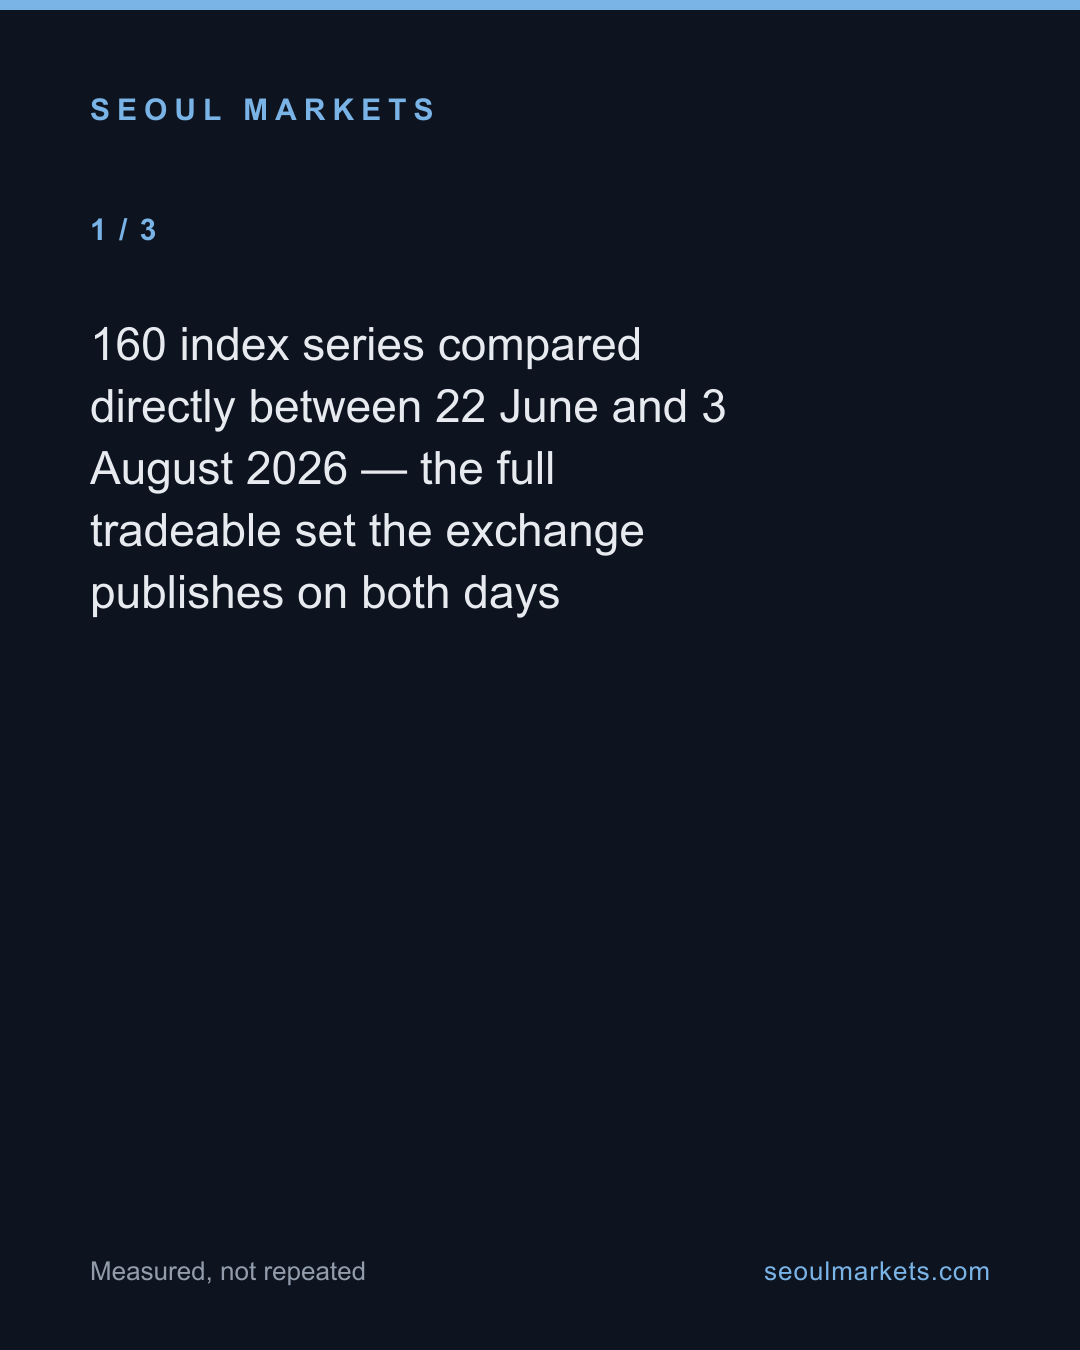
- 160 index series compared directly between 22 June and 3 August 2026 — the full tradeable set the exchange publishes on both days
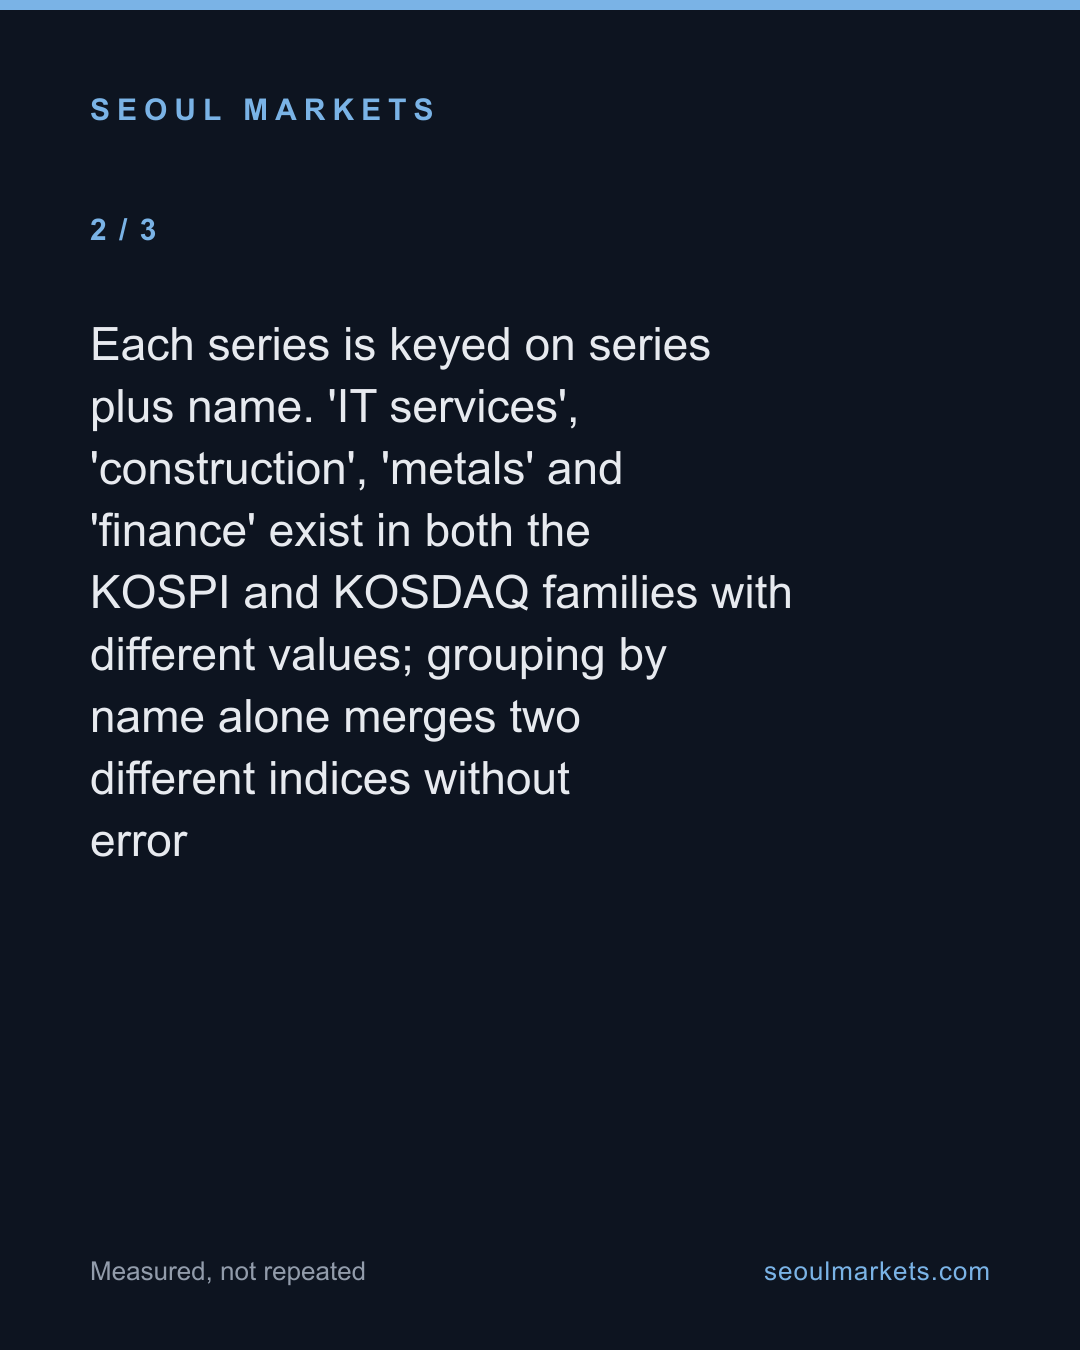
- Each series is keyed on series plus name. 'IT services', 'construction', 'metals' and 'finance' exist in both the KOSPI and KOSDAQ families with different values; grouping by name alone merges two different indices without error
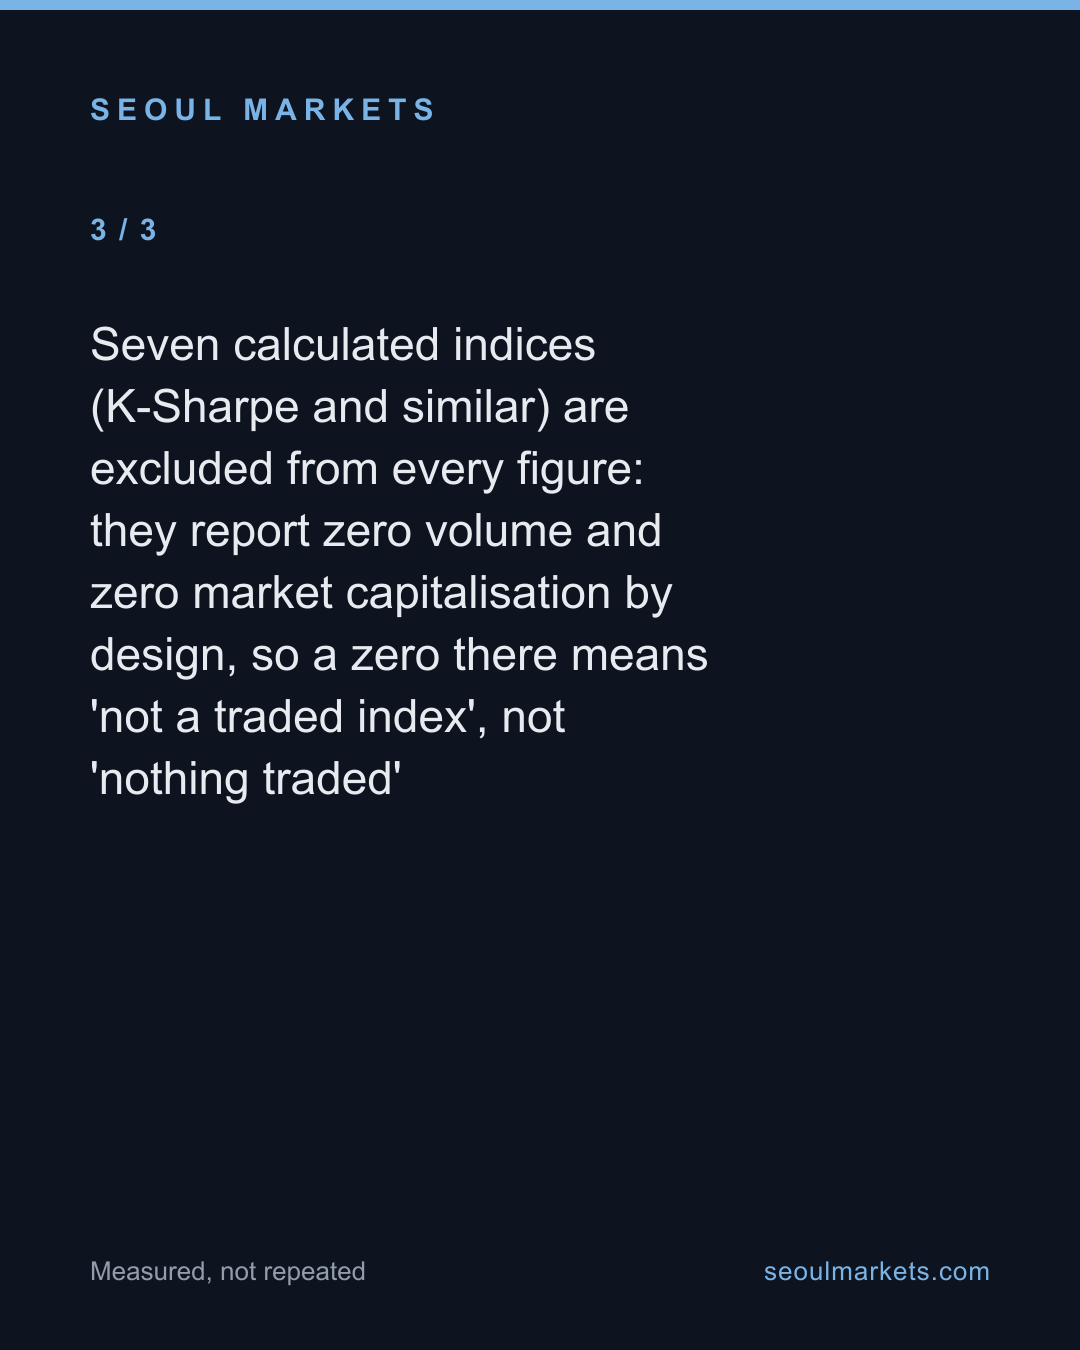
- Seven calculated indices (K-Sharpe and similar) are excluded from every figure: they report zero volume and zero market capitalisation by design, so a zero there means 'not a traded index', not 'nothing traded'
- Sector peaks were located independently within 2026 rather than assumed to be the index peak — they are not the same date, which is the point of the article
- Market-capitalisation shares are the exchange's own listed-market-cap field for each index, compared against the KOSPI's on the same day
- Excluded figures
- Why semiconductors fell, or why banks did not. The feed carries prices and market capitalisation, not reasons
- Individual company results. This is index-level data; no single stock is named except where the exchange itself publishes a single-stock index
- Valuation. That needs earnings, which are not in this dataset
- Whether the concentration is dangerous. We report its size; the judgement is not ours to make from a price file
- Anything before 2020, and any non-Korean index — neither is in our archive
The full dataset behind these figures — every listed company, every row — is available to license. SeoulMarkets data for licence →
Not investment advice. SMarkets publishes data journalism for general information only. Nothing here is investment advice, a recommendation, or an offer to buy or sell any security — any investment you make is at your own risk and responsibility. Figures are derived from official public data sources and may be revised by the issuing agency. Verify independently before acting.
Take this away — 5 cards
The figures in this article, as images. Free to repost with the address on them.