Korea's import bill rose 18% — but rubber jumped 96% and sugar fell 12%
Korea's won-priced import index rose 18.4% over the year to July 2026 — on average. Behind it: synthetic rubber +96% and fuels near +77%, while sugar and dairy fell. The won moved everything alike; the spread is the goods.
AI-assisted, human-reviewed sourcing. Figures are pulled programmatically from the official sources listed at the end of this article and checked by an editor before publication.
import pricescommoditiesinflationwonkorea
Korea’s imports cost 18.4% more in won in July 2026 than a year earlier. That single number is the one that makes headlines. It is also nearly meaningless as a description of what happened, because almost nothing actually moved by 18%.
The average hides a canyon
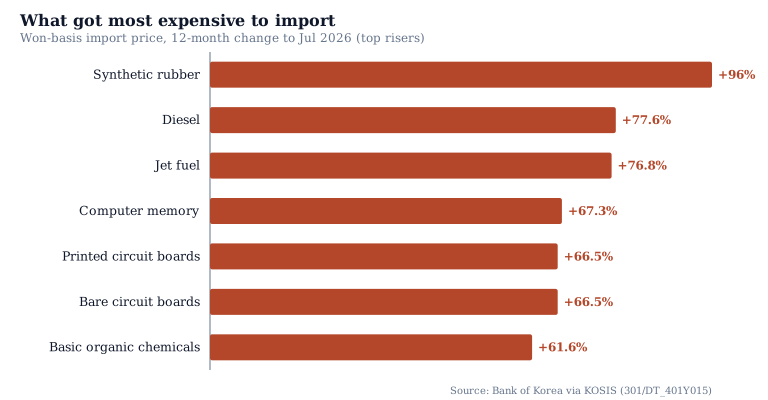
| Import line (won basis) | 12-month change |
|---|---|
| Synthetic rubber | +96.0% |
| Diesel | +77.6% |
| Jet fuel | +76.8% |
| Computer memory | +67.3% |
| Printed circuit boards | +66.5% |
| Basic organic chemicals | +61.6% |
| Average, all imports | +18.4% |
| Processed meat & dairy | −6.4% |
| Raw sugar | −11.5% |
| Refined sugar & starch | −11.5% |
The top of the list nearly doubled; the bottom got cheaper. Between synthetic rubber at +96% and sugar at −11.5% sits a spread of more than a hundred points — and the 18.4% average sits closer to the bottom of it than the middle, because the big risers are a handful of lines while most of the basket moved far less.
The won lifted everything; it did not cause the spread
It would be easy to file all of this under “the weak won.” Over the same year the won-priced index rose 18.4% while the same imports in their contract currency rose only 11.1% — the seven-point gap is the exchange rate, and priced in the seller’s own currency the increase is much smaller.
But the currency moved every line by roughly the same amount. It cannot explain why rubber rose 96% while sugar fell 11%. That gap is the goods themselves — energy and the chip-cycle inputs (memory, circuit boards) at one end, soft global food prices at the other. The won sets the level of the won index; the spread across items is real relative-price change, and it is where the economic signal is.
Reading it honestly
This ranks the size of each move, not its weight in the import bill: a 96% jump in a small line moves the total less than a 20% rise in crude. We are not weighting here, and we say so. What the ranking shows is simple and easy to lose inside a single average — Korea did not pay 18% more for everything. It paid nearly double for some things, less for others, and the gap between them is the story the headline number erases.
Won-basis 12-month changes to July 2026, Bank of Korea import price index (2020=100) via KOSIS 301/DT_401Y015. Free to reproduce with attribution — cite as SeoulMarkets (seoulmarkets.com) and link back.
Data & Verification Notes
- Data as of
- Sources
- Bank of Korea import price index (basic classification), via KOSIS — KOSIS 301/DT_401Y015, index 2020=100, won basis; 12-month change to July 2026 (Aug 2025 → Jul 2026)
- Cross-checks
- All figures are won-basis 12-month changes to July 2026 from the Bank of Korea import price index (2020=100). The headline average is +18.4% in won, +11.1% in contract currency, +9.9% in US dollars — the won-vs-contract gap is the exchange rate, covered separately
- Biggest risers (won basis): synthetic rubber +96%, diesel +77.6%, jet fuel +76.8%, computer memory +67.3%, printed circuit boards +66.5%, basic organic chemicals +61.6%
- Biggest fallers (won basis): refined sugar and starch -11.5%, raw sugar -11.5%, processed meat and dairy -6.4%. These fell even as the won weakened, so in contract currency they fell further
- Excluded figures
- Weights. This ranks the size of each item's price change, not its share of the import bill — a 96% move in a small line matters less to the total than a 20% move in crude oil. We rank moves, we do not weight them here
- Why each moved. Energy, chip-cycle demand for memory and boards, and soft global food prices all sit behind these, and the index carries the prices, not the causes
- The currency split by item. The won weakened against most invoicing currencies over the year, lifting every won figure by roughly the same amount; the spread between items is therefore about the goods, not the won. The aggregate currency effect is in the linked pieces
- This is not investment advice
The full dataset behind these figures — every listed company, every row — is available to license. SeoulMarkets data for licence →
Not investment advice. SMarkets publishes data journalism for general information only. Nothing here is investment advice, a recommendation, or an offer to buy or sell any security — any investment you make is at your own risk and responsibility. Figures are derived from official public data sources and may be revised by the issuing agency. Verify independently before acting.
← More Commodities