KOSDAQ is 7% of the market's value but 16% of its trading
Value and trading are two different maps. KOSDAQ holds 7% of Korea's market cap yet did 16% of one day's trading — its shares turn over more than twice as fast as KOSPI's. And 137 listed companies didn't trade at all. Not advice.
AI-assisted, human-reviewed sourcing. Figures are pulled programmatically from the official sources listed at the end of this article and checked by an editor before publication.
turnoverliquiditykospikosdaqtrading-volumekorea
Korea’s stock market has a well-known shape: four companies are half of all its value, and the junior board, KOSDAQ, is barely a rounding error in the total. But value and trading are two different maps. Look at where the money actually moved on a single day and KOSDAQ is not small at all.
The junior board punches above its weight
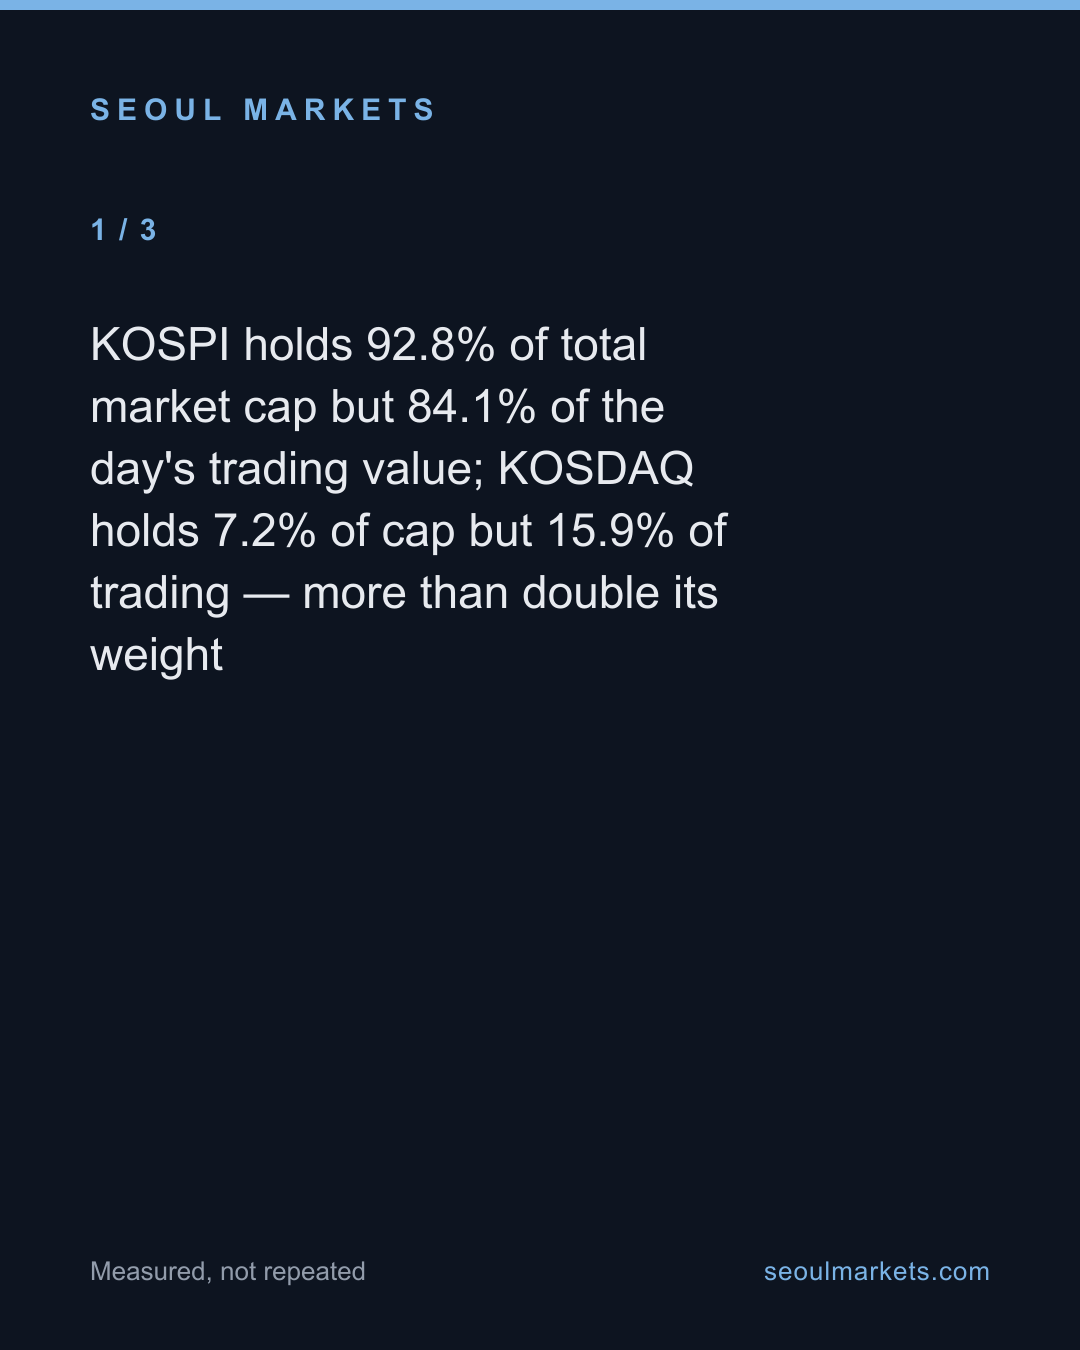
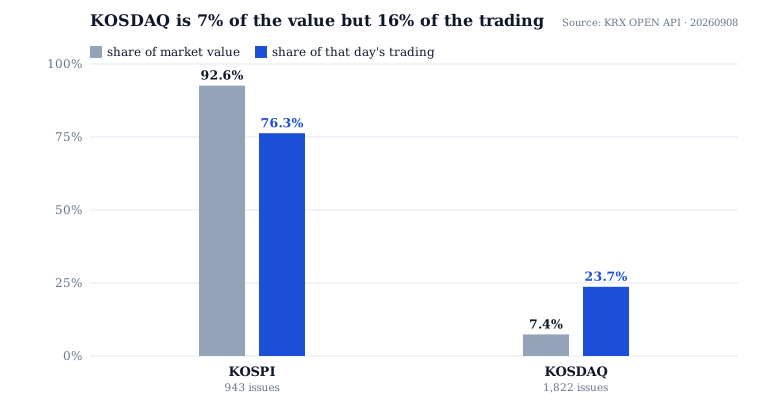
KOSDAQ is home to 1,822 of Korea’s 2,764 listed companies but only 7.2% of their combined market value. On 2026-08-21, though, it accounted for 15.9% of all trading — more than double its share of the market. KOSPI, the main board, is the mirror image: 92.8% of the value, but a smaller 84.1% of the trading.
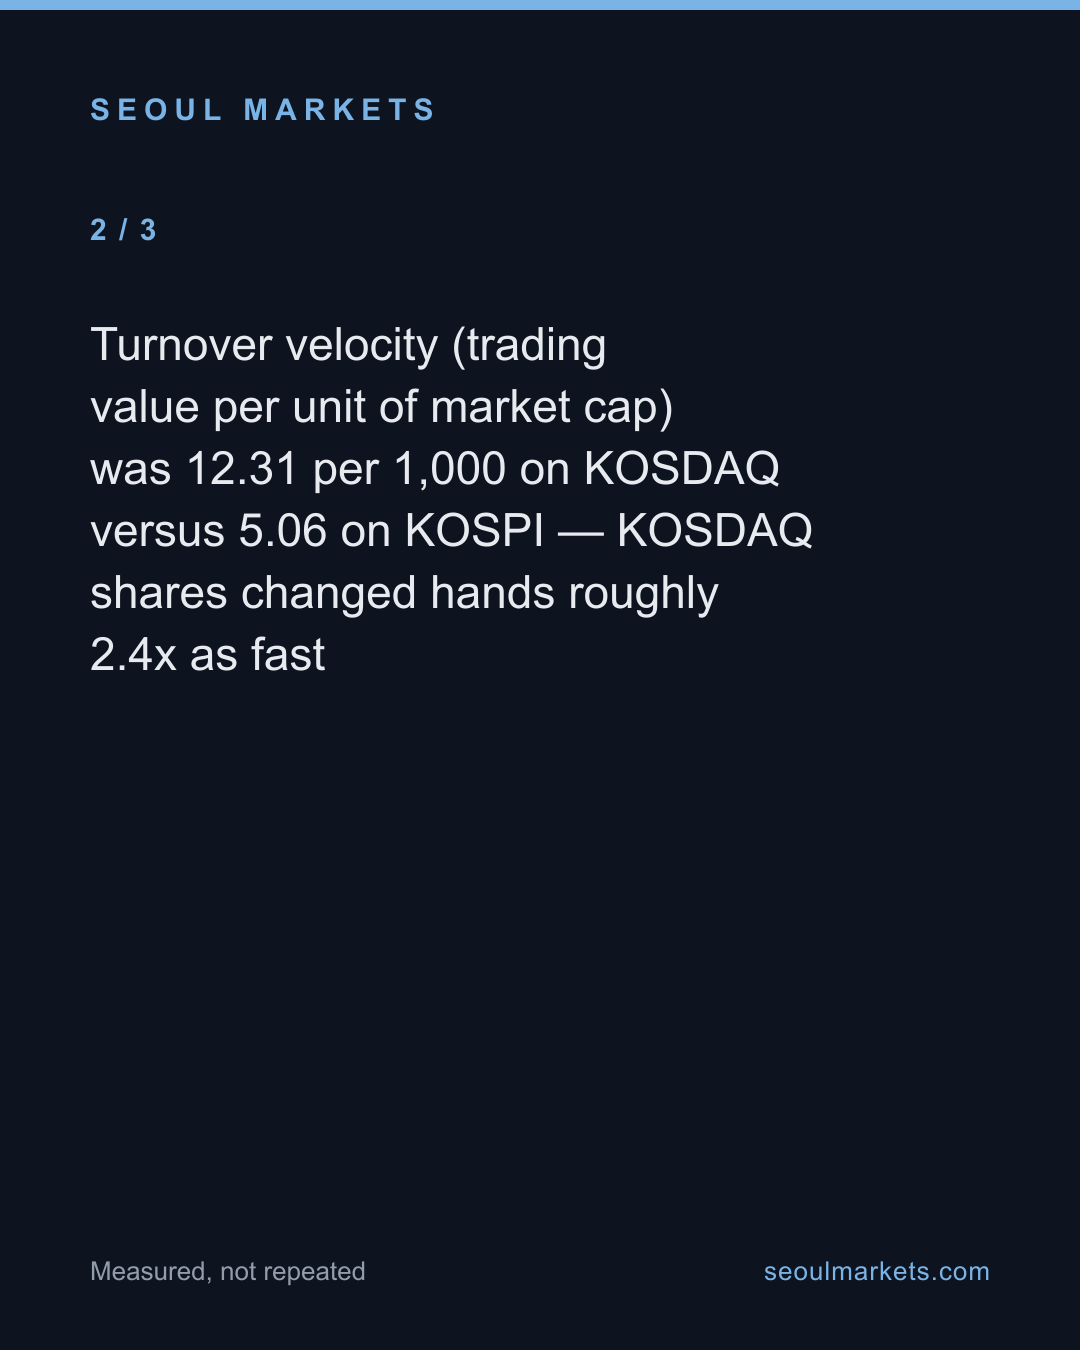
Put the two on the same footing and the gap is stark. Measured as turnover per ₩1,000 of market cap, KOSDAQ ran at 12.3 against KOSPI’s 5.1 — its shares changed hands roughly 2.4 times as fast.
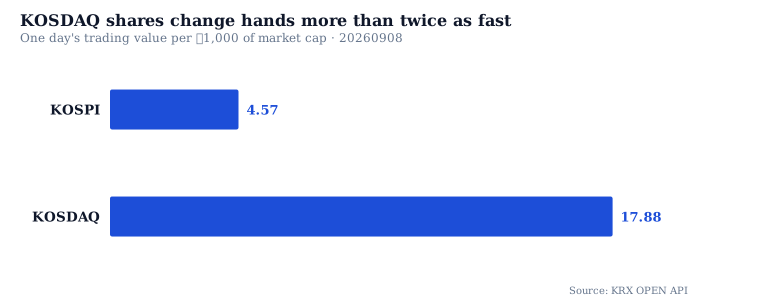
This is the difference between where wealth is stored and where it is churned. The big-cap board holds the value; the small-cap board does a disproportionate share of the buying and selling.
Trading is concentrated, too — just like value
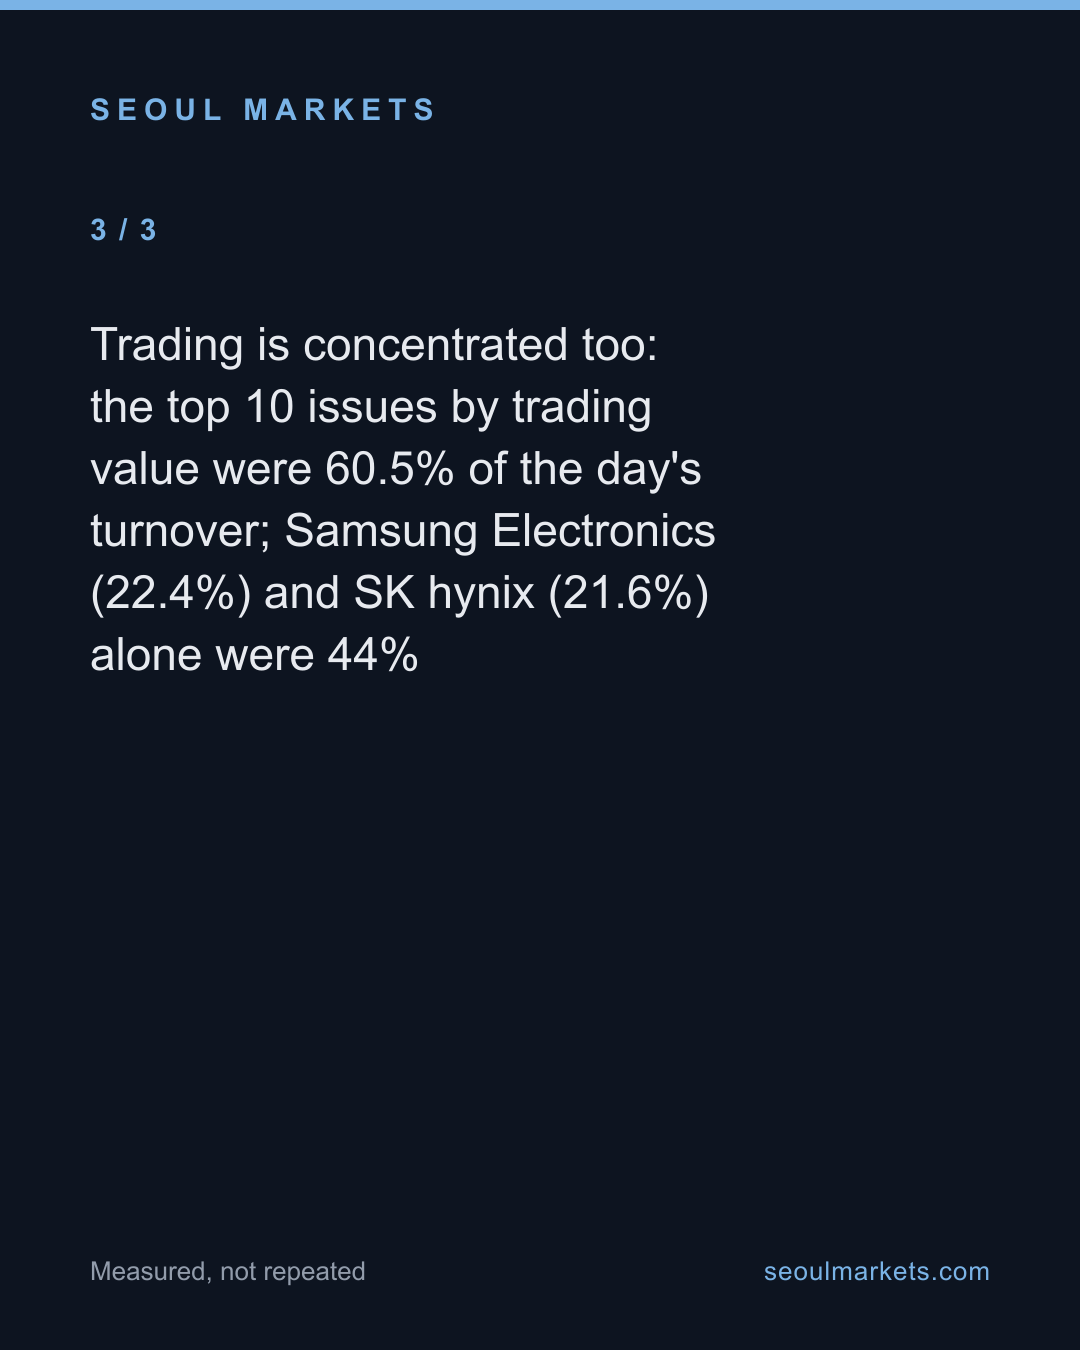
The same two names that dominate market value also dominate the tape. Samsung Electronics was 22.4% of the entire day’s trading value and SK hynix 21.6% — together 44% of everything traded across both markets. The top ten issues by turnover were 60.5% of the day. So it is not only that a handful of stocks are the market’s value; a handful of stocks are also most of its daily activity.
And at the other end, the tail goes all the way to silence: 137 of the 2,764 listed issues recorded no trades at all that day. On the paper of the exchange they exist; in the flow of money they did not move.
What this is, and is not
One caution travels with the trading figures that did not travel with the value ones. Market-value concentration is structural — it changes slowly. A single day’s trading share is not: it swings with earnings, news and mood, so KOSDAQ’s 16% is a snapshot, not a fixed law. The durable part is the velocity gap — the small-cap board consistently trades faster relative to its size, and one day shows it clearly. Every number here is a ratio, so none of it depends on the won price level. This is a description of where money moved in Korea’s market on one day, not investment advice.
Data & Verification Notes
- Data as of
- Sources
- Korea Exchange (KRX OPEN API) — Daily trading information for KOSPI (stk_bydd_trd) and KOSDAQ (ksq_bydd_trd), trading value (ACC_TRDVAL) and market cap by issue, 2026-08-21
- Cross-checks
- KOSPI holds 92.8% of total market cap but 84.1% of the day's trading value; KOSDAQ holds 7.2% of cap but 15.9% of trading — more than double its weight
- Turnover velocity (trading value per unit of market cap) was 12.31 per 1,000 on KOSDAQ versus 5.06 on KOSPI — KOSDAQ shares changed hands roughly 2.4x as fast
- Trading is concentrated too: the top 10 issues by trading value were 60.5% of the day's turnover; Samsung Electronics (22.4%) and SK hynix (21.6%) alone were 44%
- Of 2,764 listed issues, 137 recorded zero trading value on the day
- Excluded figures
- This is one trading day (2026-08-21); daily trading shares swing with the news, so the 16% figure is a snapshot, not a fixed ratio — the velocity gap between the two boards is the structural part
- All figures are reported as ratios (share of trading, turnover per unit of cap), which do not depend on the won price level
- Trading value is close price times volume as reported by KRX; it counts both sides of the tape once each as the exchange aggregates it
- This is not investment advice
The full dataset behind these figures — every listed company, every row — is available to license. SeoulMarkets data for licence →
Not investment advice. SMarkets publishes data journalism for general information only. Nothing here is investment advice, a recommendation, or an offer to buy or sell any security — any investment you make is at your own risk and responsibility. Figures are derived from official public data sources and may be revised by the issuing agency. Verify independently before acting.
Take this away — 5 cards
The figures in this article, as images. Free to repost with the address on them.