Korea's leading indicator has climbed for a year. Its coincident gauge has barely moved.
Statistics Korea's leading cyclical index rose every month for a year, 100.0 to 105.7, yearly growth doubling to 8.8%. The coincident gauge — the here-and-now — sat flat near 100. The forward signal is loud, the present quiet. Not advice.
AI-assisted, human-reviewed sourcing. Figures are pulled programmatically from the official sources listed at the end of this article and checked by an editor before publication.
business-cycleleading-indicatormacrokosiskorea
Korea keeps two official clocks on its economy. One is built to run ahead — the leading composite index, assembled from things that move early: stock prices, the yield curve, construction orders, export prices, machinery shipments. The other is built to run with the present — the coincident index, made of what is happening now: industrial output, retail sales, employment, imports. For the past year the two clocks have told very different stories.
One gauge is shouting
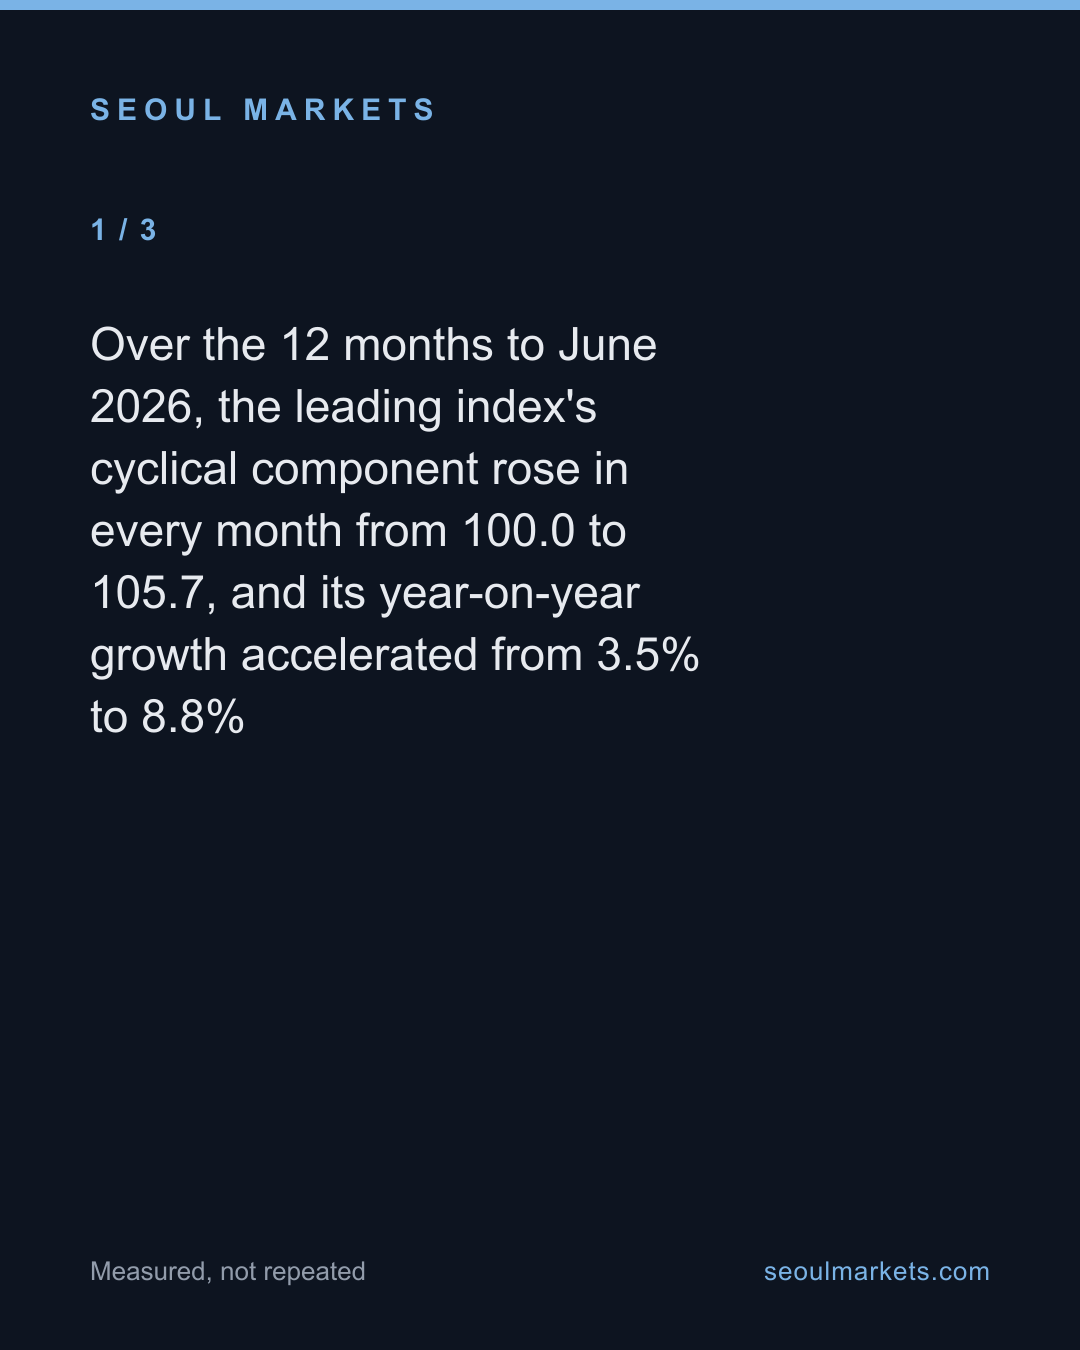
Take the cyclical component of each — the detrended figure where 100 is the long-run trend. The leading index has done something unusual: it has risen in every single month over the year to June 2026, from 100.0 to 105.7. Its year-on-year growth did not just stay positive; it accelerated, from 3.5% to 8.8%. By this measure, the forces that normally arrive before an upturn have been building steadily and without a stumble for twelve straight months.
The other has barely stirred
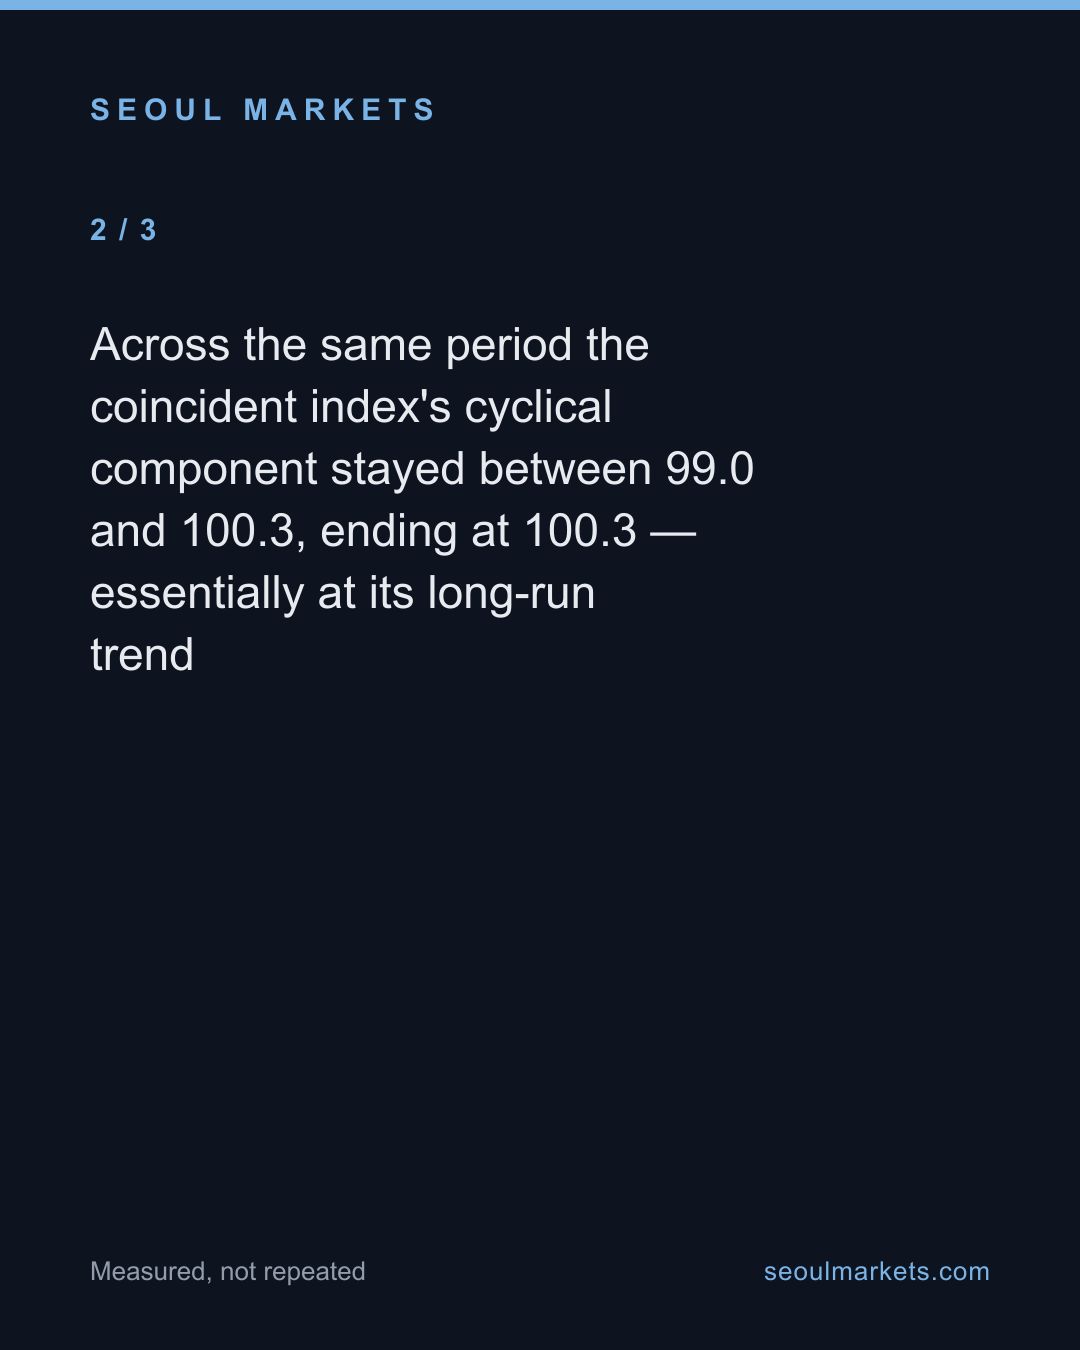
Now the coincident index — the here-and-now. Over the same twelve months its cyclical component went from 99.6 to 100.3, wandering between 99.0 and 100.3 and never leaving the neighbourhood of trend. The present, in other words, has not moved. The economy Koreans are actually living in has been flat while the gauge meant to preview the next one has climbed to a multi-year high above trend.
The gap is the whole story
A rising leading index over a flat coincident one is the textbook shape of an upturn that is signalled but not yet arrived — the forward gauge pricing improvement that the real economy has not delivered. Two things keep it honest. The cyclical component is detrended: 105.7 means well above trend, not “5.7% growth,” and these indexes turn. And the leading index contains the KOSPI and the term spread, so part of its climb is financial markets themselves betting on a recovery — the signal partly reflects sentiment rather than causing it.
This is a reading of Korea’s own official cycle gauges, not a forecast and not investment advice. What the data shows, cleanly, is a widening gap between what is coming and what is here: the leading clock has run forward for a year without pause, and the coincident clock has stood almost still. Either the present catches up to the signal, or the signal was early — and which one it is will show first in the coincident index, not the leading one.
Data & Verification Notes
- Data as of
- Sources
- Statistics Korea composite economic indexes (via KOSIS) — Cyclical components of the leading and coincident composite indexes, 2020=100, table DT_1C8015 (org 101), monthly to June 2026
- Cross-checks
- Over the 12 months to June 2026, the leading index's cyclical component rose in every month from 100.0 to 105.7, and its year-on-year growth accelerated from 3.5% to 8.8%
- Across the same period the coincident index's cyclical component stayed between 99.0 and 100.3, ending at 100.3 — essentially at its long-run trend
- The two are the official Korean business-cycle gauges: the leading index is built to turn ahead of the economy, the coincident index to move with it
- Excluded figures
- The cyclical component is a detrended figure where 100 is the long-run trend, not the level of output — a reading of 105.7 means above-trend, not '5.7% growth'
- The leading index embeds the KOSPI and the term spread, so part of its climb is financial markets pricing optimism — the signal is partly reflexive
- Any forecast — a leading index leads by a variable margin and can turn; this reports what the gauges say, not what will happen, and is not investment advice
The full dataset behind these figures — every listed company, every row — is available to license. SeoulMarkets data for licence →
Not investment advice. SMarkets publishes data journalism for general information only. Nothing here is investment advice, a recommendation, or an offer to buy or sell any security — any investment you make is at your own risk and responsibility. Figures are derived from official public data sources and may be revised by the issuing agency. Verify independently before acting.
Take this away — 5 cards
The figures in this article, as images. Free to repost with the address on them.