28,244 falls: Korea's top workplace injury in 2024
Korea's Ministry of Employment and Labor tracks every reported workplace injury by cause. In 2024, simple falls and slips — not machinery, not falls from height — injured more workers than anything else. A second cause is catching up fast.
AI-assisted, human-reviewed sourcing. Figures are pulled programmatically from the official sources listed at the end of this article and checked by an editor before publication.
workplace safetylaborkoreakosisinjury
Every year, Korea’s Ministry of Employment and Labor publishes a full accounting of workplace injuries by cause — a legally mandated statistic, not a survey. We pulled the five most recent years directly from KOSIS to see not just how many workers got hurt, but specifically how.
The obvious guess is wrong
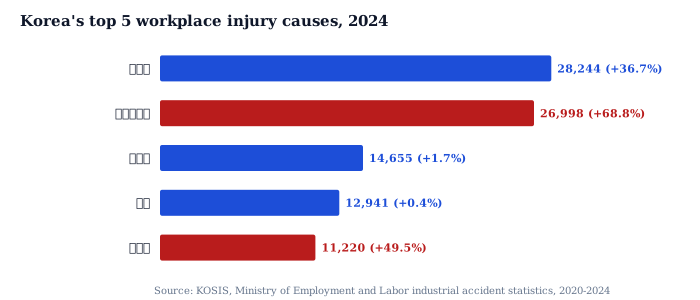
| Cause | 2024 cases | 2020 cases | 5-year change |
|---|---|---|---|
| Falls / slips (same level) | 28,244 | 20,659 | +36.7% |
| Occupational disease | 26,998 | 15,996 | +68.8% |
| Falls from height | 14,655 | 14,406 | +1.7% |
| Caught in machinery | 12,941 | 12,894 | +0.4% |
| Struck by / against objects | 11,220 | 7,503 | +49.5% |
If you pictured Korean workplace injuries as mostly industrial accidents — machinery, falls from scaffolding — the numbers say otherwise. The single largest cause, every year for five straight years, is simply falling on level ground.
Why would falls be the biggest category, not machinery?
This is the question the raw count doesn’t answer, and it’s worth sitting with. A few things this data does tell us: falls-from-height and machinery entrapment — the injury types that sound most like “industrial accidents” — have barely grown in five years (+1.7% and +0.4%). Whatever is driving the overall 31.7% rise in total injuries, it is concentrated almost entirely in same-level falls, occupational disease, and being struck by objects — the three fastest-growing categories, all up between 37% and 69%.
That pattern is consistent with a workforce spread across more service-sector and logistics-type jobs, where slips on wet or cluttered floors and repetitive-motion or exposure-related illness are more common risks than being caught in a press or crane. But this dataset alone can’t confirm that — it counts causes, not industries-of-employment for each cause, and it doesn’t record workplace age, staffing ratios, or which safety programmes were or weren’t in place. That’s the next question worth asking, and one we don’t have the data in hand to answer yet.
The one growing fastest is not the one in the lead — yet
Falls still lead by a margin of 1,246 cases in 2024. But occupational disease has grown nearly twice as fast (+68.8% vs +36.7%) over the same five years, and at that relative pace, it’s the category to watch — not because it’s the largest today, but because the gap is closing. This is exactly the kind of thing a single year’s headline count won’t show you: you need the trend, not just the level, to see where the real change is happening.
This is a measure of reported cases, not workplace conditions at any specific company, and it is not investment advice.
The debate
Falls, not machinery, are Korea’s leading workplace injury cause — and the fastest-growing one isn’t falls at all, it’s occupational disease. What does that combination tell you about how work itself has changed? What do you think? This is a talking point, not a verdict — argue it out below.
Data & Verification Notes
- Data as of
- Sources
- Ministry of Employment and Labor / Korea Occupational Safety and Health Agency, via KOSIS — KOSIS DT_11806_N011 — industrial accident statistics by cause of injury, all industries, 2020–2024, pulled and computed by us
- Cross-checks
- 2024 total reported injuries across all industries: 142,771, up 31.7% from 108,379 in 2020
- Falls/slips (넘어짐, same-level falls) were the single largest cause every year 2020–2024: 28,244 cases in 2024, up 36.7% from 20,659 in 2020
- Occupational disease (업무상질병) is the fastest-growing major cause: 26,998 cases in 2024, up 68.8% from 15,996 in 2020 — closing in on falls as the largest category
- By contrast, falls from height (떨어짐, +1.7%) and being caught in machinery (끼임, +0.4%) barely moved over the same five years
- Excluded figures
- Why falls specifically are rising while machinery-related injuries are flat — this dataset records cause categories and industry, not root-cause factors like workplace age, staffing levels, or specific safety-programme rollouts
- Severity or cost per injury — this is a headcount of reported injury cases, not a measure of how serious each case was
- Any claim about which specific companies or sites are responsible — the data is aggregated at the national, all-industry level
The full dataset behind these figures — every listed company, every row — is available to license. SeoulMarkets data for licence →
Not investment advice. SMarkets publishes data journalism for general information only. Nothing here is investment advice, a recommendation, or an offer to buy or sell any security — any investment you make is at your own risk and responsibility. Figures are derived from official public data sources and may be revised by the issuing agency. Verify independently before acting.
← More Macro