Only 12 of Korea's 160 stock indices are up since the June peak
The KOSPI is up 125% in two years — a headline that hides the turn. From the 22 June peak, 148 of 160 indices have fallen, the median down 19.3%. The rally was chips; the correction is everything else. As of 3 Aug 2026. Not advice.
AI-assisted, human-reviewed sourcing. Figures are pulled programmatically from the official sources listed at the end of this article and checked by an editor before publication.
kospiconcentrationsemiconductorsmarket-breadthkorea
Korea’s market has one number everyone repeats: the KOSPI is up about 125% in two years. It is true, and it is the least informative thing you can say about where the market is now.
The headline hides the turn
The same index is down 31.3% from its peak on 22 June 2026. And that peak is the right place to look from, because when you measure every index from it, the market that the +125% headline describes has already turned.
Of the 160 tradeable indices the exchange publishes, only 12 are above their 22-June level. 148 are below it. The median index is down 19.3% from the peak. This is not a market pausing near a high — it is a market that ran, topped, and broadly reversed, with the average corner well into a correction.
The rally was chips. So is the correction.
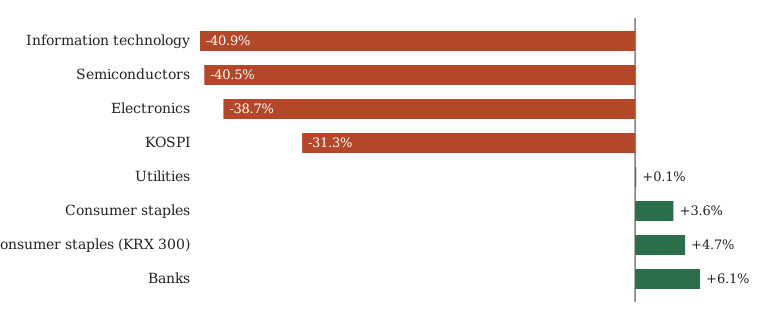
The two-year gain was never the whole market; it was a narrow set of leaders. The KRX Electronics index is +238.8% over two years — nearly double the KOSPI’s rise. But narrow leadership cuts both ways. Measured from the June peak, the leaders have fallen the hardest:
- Information technology — 40.9%
- Semiconductors — 40.5%
- Electronics — 38.7%
- KOSPI — 31.3%
Everything that led is down more than the index. What is up since the peak is the opposite kind of stock — the defensive, dividend, slow-growth kind:
- Banks + 6.1%
- Consumer staples + 3.6% (and +4.7% on the KRX 300 cut)
- Utilities + 0.1%
Banks never even peaked in June; their high was back in February, and they have given up less than 10% since.
Why this is the story, not the +125%
A single index number is a weighted average, and in a market this concentrated the average is the few largest names. When two chip stocks are half the trading and the biggest sector indices are semiconductors, the KOSPI is the chip trade — on the way up and on the way down. The breadth number (12 of 160) and the median (−19.3%) say what the headline cannot: most of the Korean market is not where the KOSPI is.
We are not calling a top or a bottom, and this is a dated reading (early August). The point is narrower and, we think, more useful than a forecast: when you look at the whole distribution instead of one number, Korea’s rally was never broad, and its correction already is.
Not investment advice — percentage changes from official KRX index closes, every figure dated.
Data & Verification Notes
- Data as of
- Sources
- Korea Exchange (KRX) — KRX index daily closes for 160 tradeable indices, 2024-08-01 through 2026-08-03; two-year change, and change from each index's own peak
- Cross-checks
- Of 160 tradeable KRX indices, only 12 were above their level of the KOSPI's 22 June 2026 peak; 148 were below it, and the median index was down 19.3% from the peak
- The KOSPI is +125.3% over two years (2,777.68 to 6,257.45) but -31.3% from its 22 June peak; the KRX Electronics index is +238.8% over two years yet -38.7% from peak
- The deepest falls from peak are the rally's leaders: Information technology -40.9%, Semiconductors -40.5%, Electronics -38.7% — all steeper than the KOSPI's -31.3%
- The only groups above water since the peak are defensives: Banks +6.1%, Consumer staples +3.6% to +4.7%, Utilities +0.1%
- Excluded figures
- This is a dated snapshot: the window ends 2026-08-03 and the market has moved since; read the figures as 'as of early August 2026', not today's levels
- All figures are percentage changes (scale-invariant), not won price levels; 'peak' is each index's close on the KOSPI's peak date (22 June 2026), except where an index peaked earlier (Banks peaked 20 Feb)
- Tradeable indices exclude computed/factor indices (e.g. Sharpe-type) that carry no trading volume
- This is not investment advice
The full dataset behind these figures — every listed company, every row — is available to license. SeoulMarkets data for licence →
Not investment advice. SMarkets publishes data journalism for general information only. Nothing here is investment advice, a recommendation, or an offer to buy or sell any security — any investment you make is at your own risk and responsibility. Figures are derived from official public data sources and may be revised by the issuing agency. Verify independently before acting.
← More Equities