Korea's listed firms: median tenure is 6.2 years
A census of 2,839 Korean listed companies' own annual filings: the median company's staff has stayed 6.2 years on average. 1 in 8 companies average under 3 years — and a smaller 1 in 17 average 15 years or more.
AI-assisted, human-reviewed sourcing. Figures are pulled programmatically from the official sources listed at the end of this article and checked by an editor before publication.
tenurelabor marketkoreadartcensus
Every listed company in Korea reports its staff’s average tenure once a year, in a legally required filing item called empSttus. We pulled it directly from all 2,924 listed companies’ FY2025 annual reports and built a census — not a ranking of which industries hold workers longest, but a picture of where every company sits.
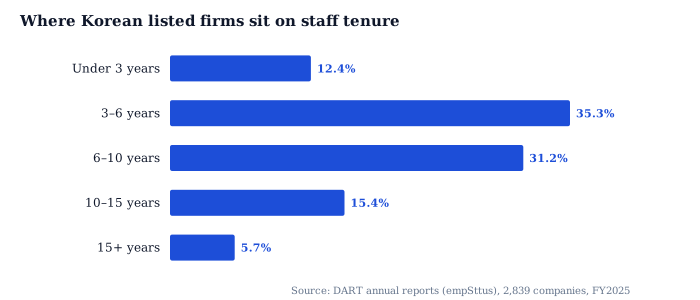
Not an average — a distribution
| Average tenure | Share of 2,839 companies |
|---|---|
| Under 3 years | 12.4% |
| 3–6 years | 35.3% |
| 6–10 years | 31.2% |
| 10–15 years | 15.4% |
| 15+ years | 5.7% |
This is a statistic, not a portrait of any one workplace. Most companies cluster in the 3-to-10-year range, but the tails matter: roughly 1 in 8 companies sit under 3 years, and 1 in 17 sit at 15 years or beyond.
The number that summarizes it, and the number that doesn’t
If you want one number: the median company in this dataset reports an average staff tenure of 6.19 years. But the single number hides real spread. Nearly half of all companies (47.7%) sit below that median band, in the under-6-year range — and within that group, 353 companies, about one in eight, average less than three years. At the other end, 162 companies keep their staff 15 years or longer on average, closer to a career than a job.
Together, the 2,839 companies in this census employ 1,872,947 people as of their FY2025 filings — this is not a small sample, it is most of Korea’s listed corporate workforce.
What this number can’t tell you
This is an average tenure figure per company, not a breakdown of why people stay or leave. A company with a young workforce in a fast-growing sector will show low average tenure even with excellent retention, simply because it has not existed long enough to accumulate long-tenured staff; a company with heavy turnover among junior staff but a stable senior core can show a similar number for the opposite reason. DART’s disclosure does not separate these cases, so we don’t either.
This is a measure of the reported statistic, not investment or employment advice, and it is not investment advice.
A related, narrower piece — which industries hold onto workers longest, ranked by headcount-weighted average tenure — asks a different question of similar underlying data: not where each company sits, but where each industry sits.
The debate
Nearly half of Korea’s listed companies report average staff tenure under six years. Is that evidence of a dynamic, mobile labor market, or of weak retention across a broad swath of listed Korea? What do you think? This is a talking point, not a verdict — argue it out below.
Data & Verification Notes
- Data as of
- Sources
- Financial Supervisory Service (Korea) — DART — OpenDART empSttus (Employee Status, annual report, reprt_code 11011), all 2,924 listed companies queried directly by corp_code, FY2025
- Cross-checks
- 2,839 of 2,924 listed companies disclosed a usable average tenure figure — the population we measure
- Median company: staff have stayed an average of 6.19 years — computed by us directly from each company's own reported average tenure
- Distribution: 12.4% of companies average under 3 years, 35.3% sit in 3–6 years, 31.2% in 6–10 years, 15.4% in 10–15 years, and 5.7% average 15 years or more
- Together these 2,839 companies employ 1,872,947 people as of their FY2025 filings — the population this distribution describes
- Excluded figures
- Why tenure varies — industry mix, company age, contract type, and layoffs are not in this disclosure item. empSttus gives one average-tenure figure per company, not a breakdown by role or reason for departure
- Non-listed companies — this disclosure is a listed-company legal requirement. Most of Korea's workforce, at unlisted firms, is not measured here
- A company-by-company ranking — this is a population distribution, not a leaderboard. A related, industry-level ranking is linked below
The full dataset behind these figures — every listed company, every row — is available to license. SeoulMarkets data for licence →
Not investment advice. SMarkets publishes data journalism for general information only. Nothing here is investment advice, a recommendation, or an offer to buy or sell any security — any investment you make is at your own risk and responsibility. Figures are derived from official public data sources and may be revised by the issuing agency. Verify independently before acting.
← More Macro