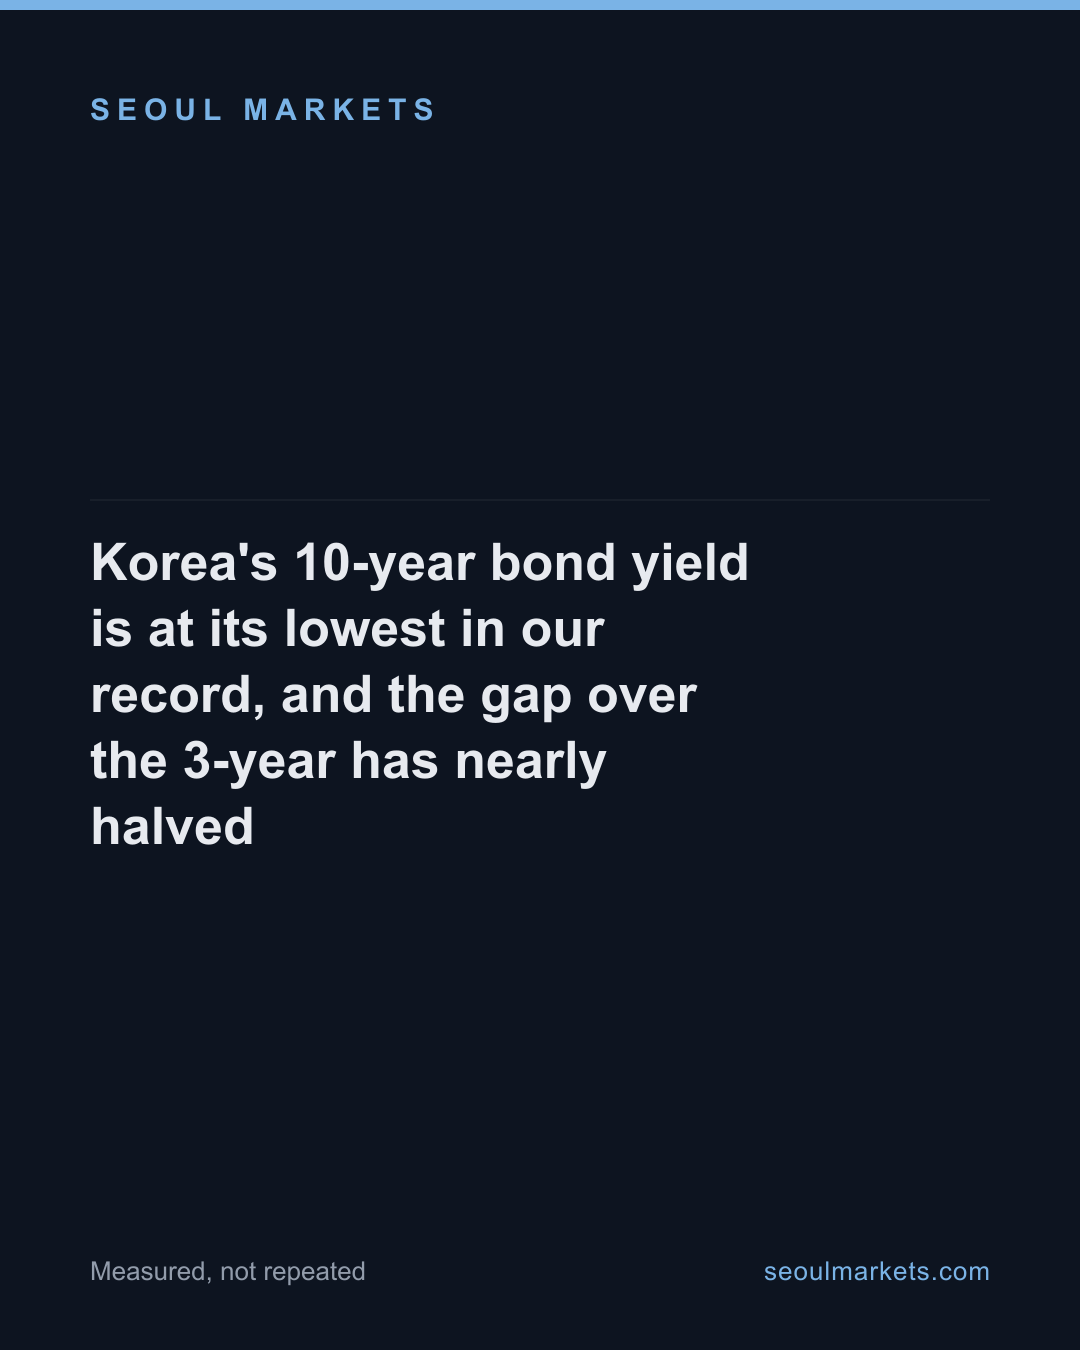
Korea's 10-year bond yield is at its lowest in our record, and the gap over the 3-year has nearly halved
The benchmark 10-year treasury yield closed at 4.154% on 22 October, down 44.5 basis points from its 15 September high. The 3-year fell less, so the 10-year spread over it is 31.4bp, against 53.8bp in August.
AI-assisted, human-reviewed sourcing. Figures are pulled programmatically from the official sources listed at the end of this article and checked by an editor before publication.
korea treasuryktbkorea bond yieldyield curve10-year yieldkorea rates
Korea’s benchmark 10-year treasury yield closed at 4.154% on 22 October, the lowest close in the 49 trading days we have collected since 10 August. It was 4.599% on 15 September. In five weeks it has fallen 44.5 basis points.
The short end has not followed it down as far. That has flattened the curve.
Three maturities, three dates
| 10 Aug | High | 22 Oct | |
|---|---|---|---|
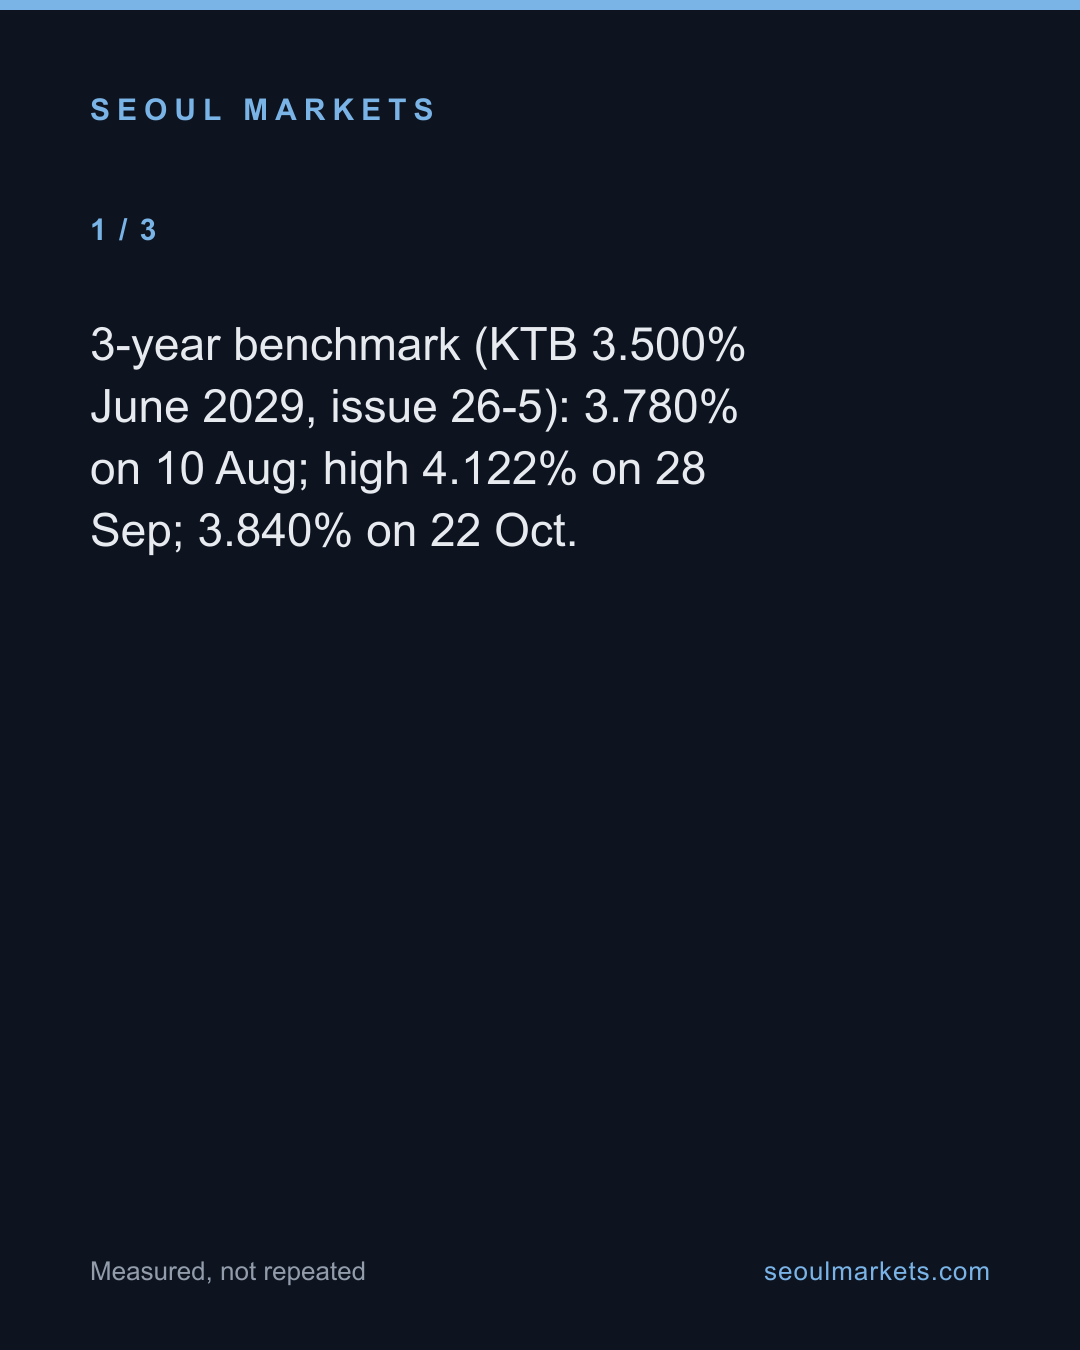
| 3-year | 3.780% | 4.122% (28 Sep) | 3.840% |
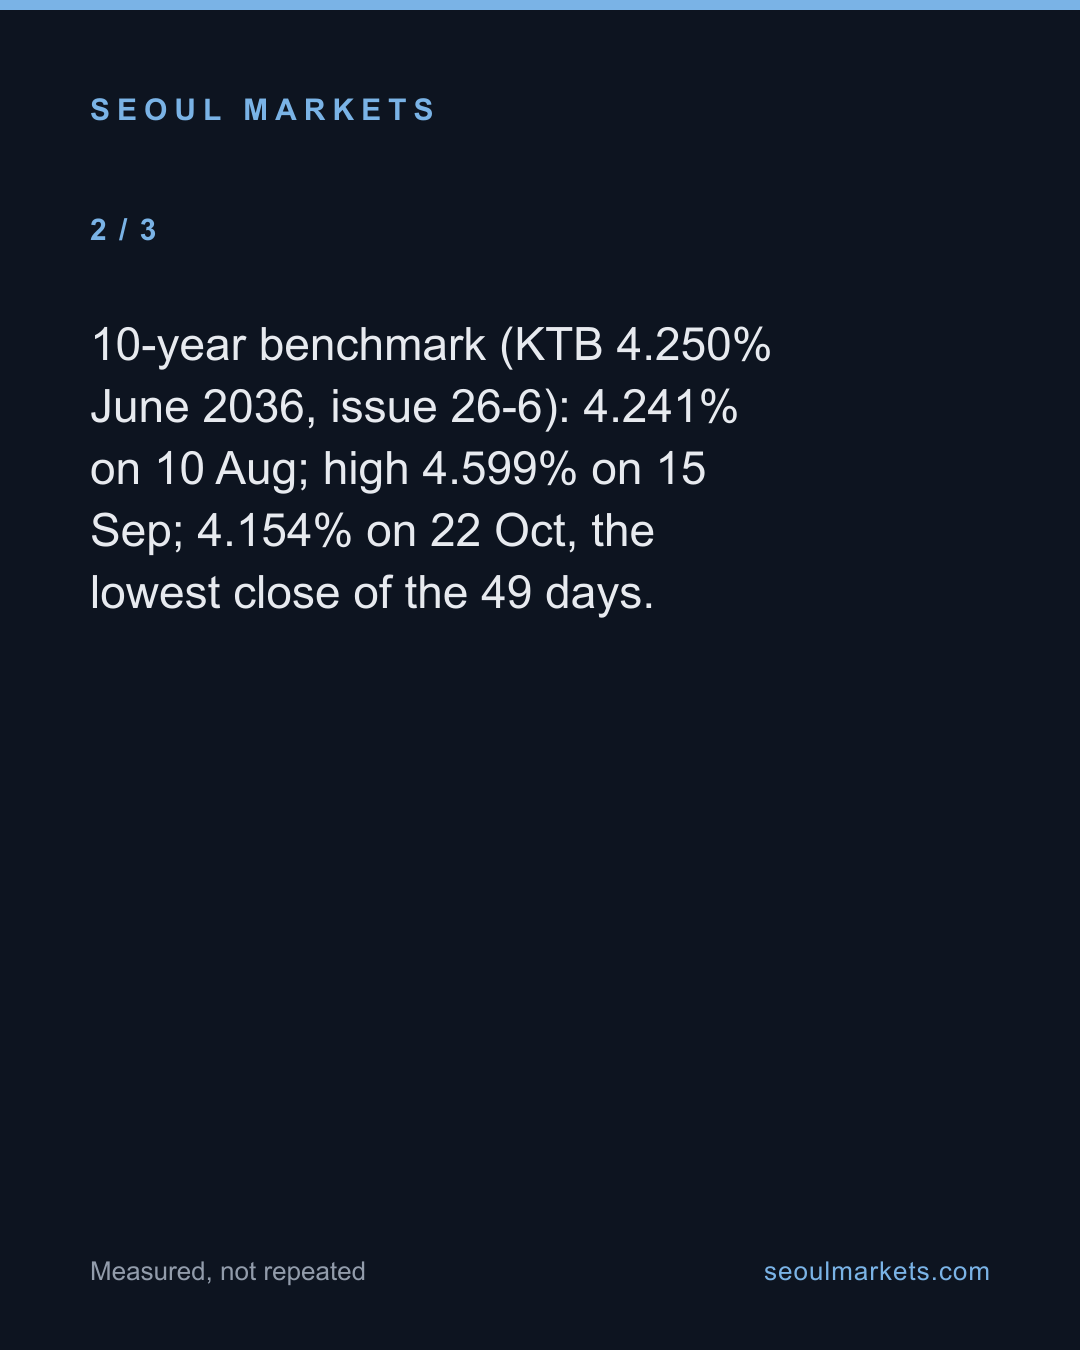
| 10-year | 4.241% | 4.599% (15 Sep) | 4.154% |
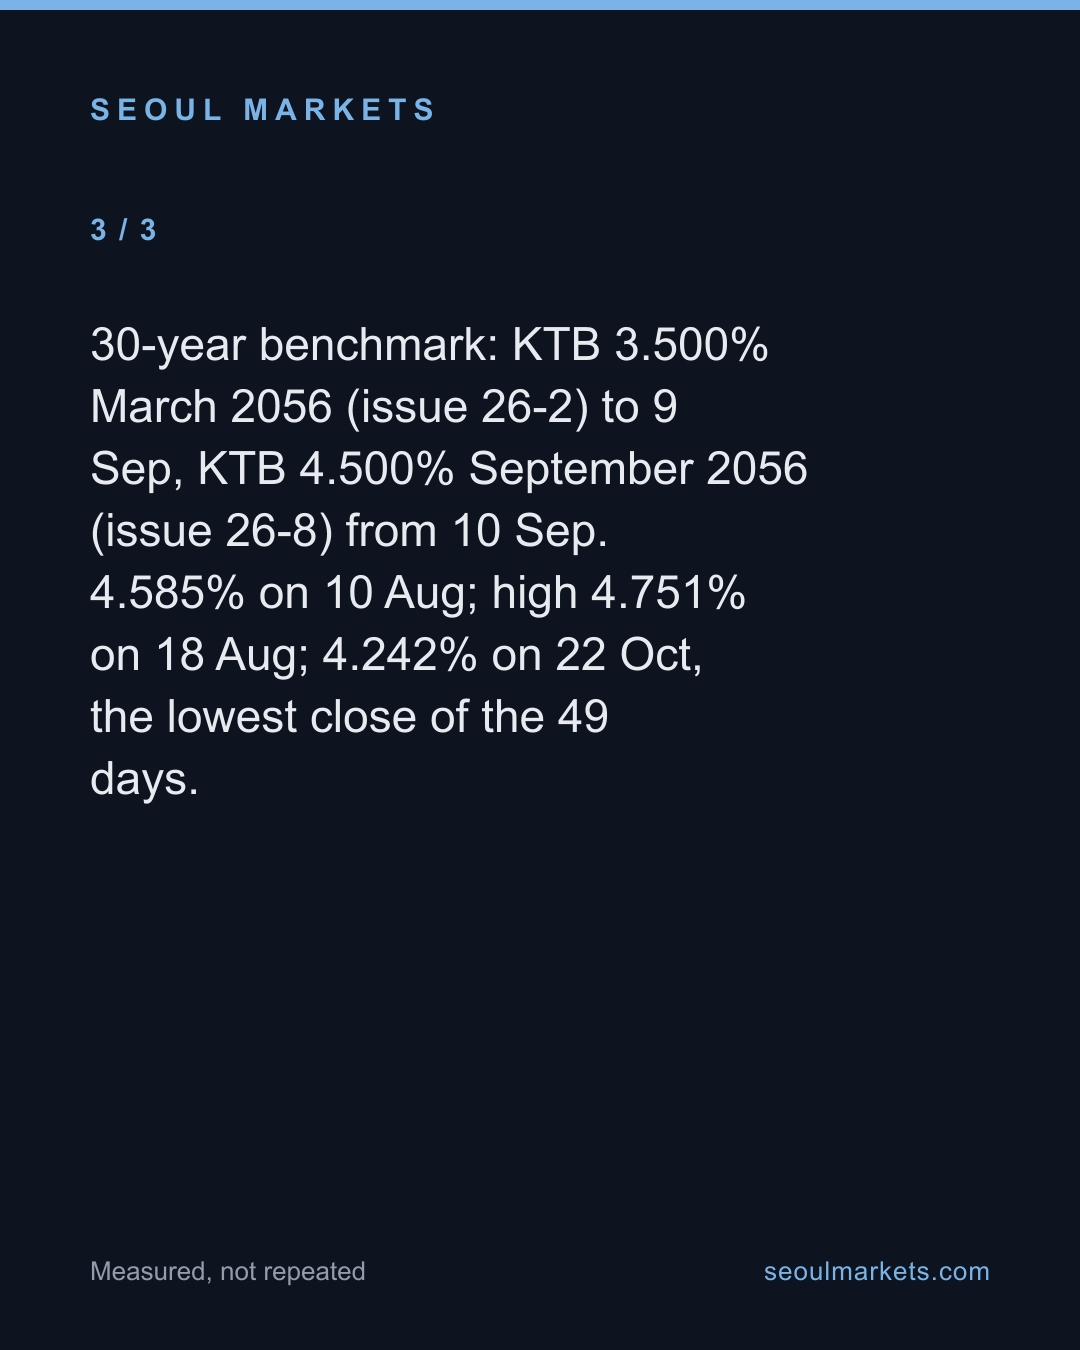
| 30-year | 4.585% | 4.751% (18 Aug) | 4.242% |
The 3-year yield is higher now than in early August. The 10-year and 30-year are lower. Over the whole window, the long end fell and the short end rose.
The gap has nearly halved
| Spread | 10 Aug | Widest | 22 Oct |
|---|---|---|---|
| 10-year minus 3-year | 46.1bp | 53.8bp (19 Aug) | 31.4bp |
| 30-year minus 3-year | 80.5bp | 91.7bp (19 Aug) | 40.2bp |
In mid-August an investor got 92 basis points more a year for lending to the Korean government for 30 years rather than 3. Now it is 40. In August we drew the whole curve for one day; the same curve today is much flatter.
The same weeks in stocks
The long-bond rally lines up with the stock slide. From 15 September, the day of the 10-year high, to 22 October, the KOSPI fell from 6,627 to 5,534. Falling long yields alongside falling stocks is the pattern of money moving toward safer assets, but these figures do not show who bought, and we have not tested the cause.
What this does not say
A flatter curve is often read as a sign that markets expect slower growth or lower policy rates later. That is a reading, not a measurement. What the closes show is how much the long end has fallen relative to the short end, and that the 10-year is lower than on any day since 10 August, when our record starts.
Korea Exchange KTS (treasury specialist market) daily closing yields, 10 August – 22 October 2026, collected daily by SeoulMarkets. Benchmark = most-traded issue of each remaining maturity. Not investment advice.
Data & Verification Notes
- Data as of
- Sources
- Korea Exchange (KRX OPEN API) — Bond market daily trading, Korea Treasury Bond specialist market (KTS): closing yield, remaining maturity and value traded per issue, 49 trading days from 10 August to 22 October 2026, collected daily by SeoulMarkets. Benchmark for each maturity = the most-traded issue of that remaining maturity that day.
- Cross-checks
- 3-year benchmark (KTB 3.500% June 2029, issue 26-5): 3.780% on 10 Aug; high 4.122% on 28 Sep; 3.840% on 22 Oct.
- 10-year benchmark (KTB 4.250% June 2036, issue 26-6): 4.241% on 10 Aug; high 4.599% on 15 Sep; 4.154% on 22 Oct, the lowest close of the 49 days.
- 30-year benchmark: KTB 3.500% March 2056 (issue 26-2) to 9 Sep, KTB 4.500% September 2056 (issue 26-8) from 10 Sep. 4.585% on 10 Aug; high 4.751% on 18 Aug; 4.242% on 22 Oct, the lowest close of the 49 days.
- 10-year minus 3-year: 46.1bp on 10 Aug; widest 53.8bp on 19 Aug; 31.4bp on 22 Oct, the narrowest. 30-year minus 3-year: 80.5bp; widest 91.7bp on 19 Aug; narrowest 39.8bp on 19 Oct; 40.2bp on 22 Oct.
- Excluded figures
- Why yields fell. We did not test causes; the stock-market fall over the same weeks is noted, not claimed as the reason.
- The 30-year benchmark changed issue on 10 September. The new issue carries a higher coupon; the two are close in maturity but not identical, so the 30-year line has a seam there.
- Bank of Korea policy-rate expectations, foreign holdings and futures. KRX cash-bond closes only.
- This is not investment advice.
The full dataset behind these figures — every listed company, every row — is available to license. SeoulMarkets data for licence →
Not investment advice. SMarkets publishes data journalism for general information only. Nothing here is investment advice, a recommendation, or an offer to buy or sell any security — any investment you make is at your own risk and responsibility. Figures are derived from official public data sources and may be revised by the issuing agency. Verify independently before acting.
Take this away — 5 cards
The figures in this article, as images. Free to repost with the address on them.