In Korea, the brokers that promise the most upside hit their targets the least
Score 19,495 broker targets against the stock a year on and a pattern appears: the more upside a house promised, the less often it was reached — a −0.46 correlation. Hanwha aimed for 45% and hit 17%; DB aimed 29% and hit 49%.
AI-assisted, human-reviewed sourcing. Figures are pulled programmatically from the official sources listed at the end of this article and checked by an editor before publication.
brokeragesanalyststarget priceresearchkorea
There is a temptation, writing a research report, to reach for the bigger number. A 45% target gets attention a 20% one does not. Score enough of those targets against what the stocks actually did, and the temptation shows up as a pattern: in Korea, the houses that promise the most tend to deliver the least.
The higher the aim, the lower the hit
Take each brokerage’s average target upside and its target hit rate over twelve months, across 18 houses with a meaningful sample, and the two move in opposite directions — a correlation of −0.46. The houses aiming highest are not the ones getting there.
| Brokerage | Avg upside promised | Targets met (12m) |
|---|---|---|
| Hanwha | 44.6% | 16.6% |
| Samsung | 44.1% | 24.0% |
| Yuanta | 41.0% | 22.6% |
| … | ||
| DB Financial | 28.6% | 49.4% |
DB Financial aimed lower than almost anyone — an average 29% upside — and reached its targets nearly half the time, the best record in the set. Hanwha aimed highest, at 45%, and reached one in six.
What it means, and what it doesn’t
This is not proof that a modest target is better research. A conservative call can be right by accident, and a bold one can be early rather than wrong. What the −0.46 measures is calibration: as a house’s targets climb, the share that actually print falls away. The bigger number wins the reader and loses the year. One honest limit: with only 18 houses in the set, that correlation sits just short of the conventional statistical bar (t = −2.08 against a critical 2.12) — a tendency worth watching, not a proven law. The clearest individual cases, Hanwha and DB Financial, are each built on hundreds of reports and stand well apart from each other on their own.
For anyone reading a Korean broker report, the useful move is not to trust the target but to know the house’s record behind it — how high it tends to aim, and how often it lands. That record is not in the report. It is only visible once someone keeps the targets and the prices side by side, long enough to score them.
Data & Verification Notes
- Data as of
- Sources
- Korea Exchange (close prices) — Daily stock prices via the public data portal (data.go.kr dataset 15094808)
- Brokerage research (published facts) — Report date, brokerage, stock, target price and rating — as published by each house
- Cross-checks
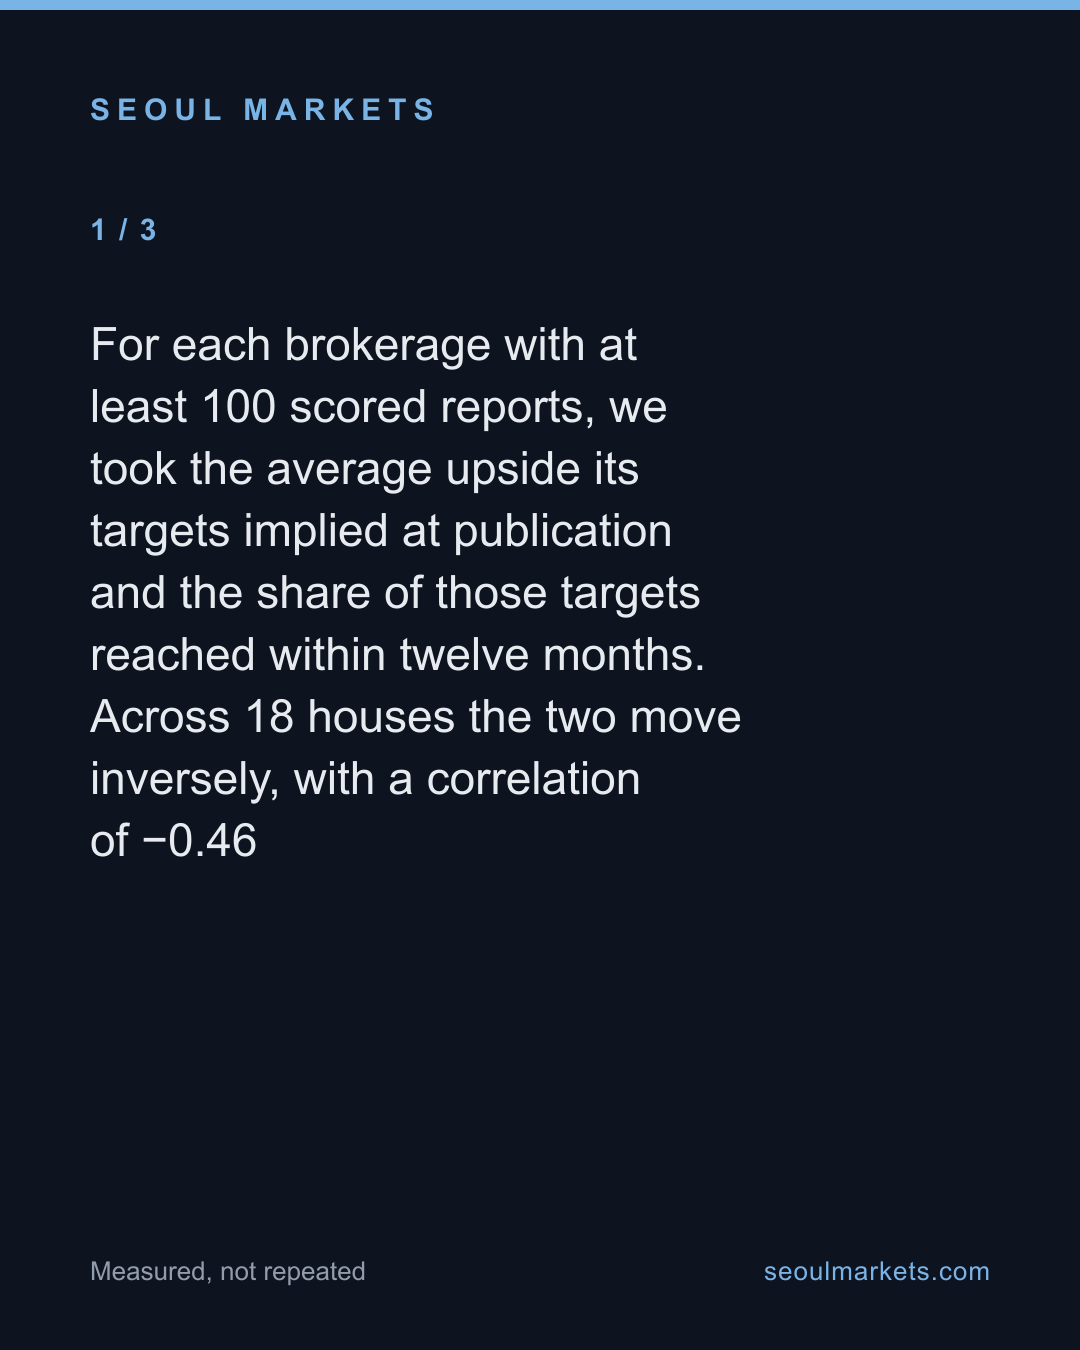
- For each brokerage with at least 100 scored reports, we took the average upside its targets implied at publication and the share of those targets reached within twelve months. Across 18 houses the two move inversely, with a correlation of −0.46
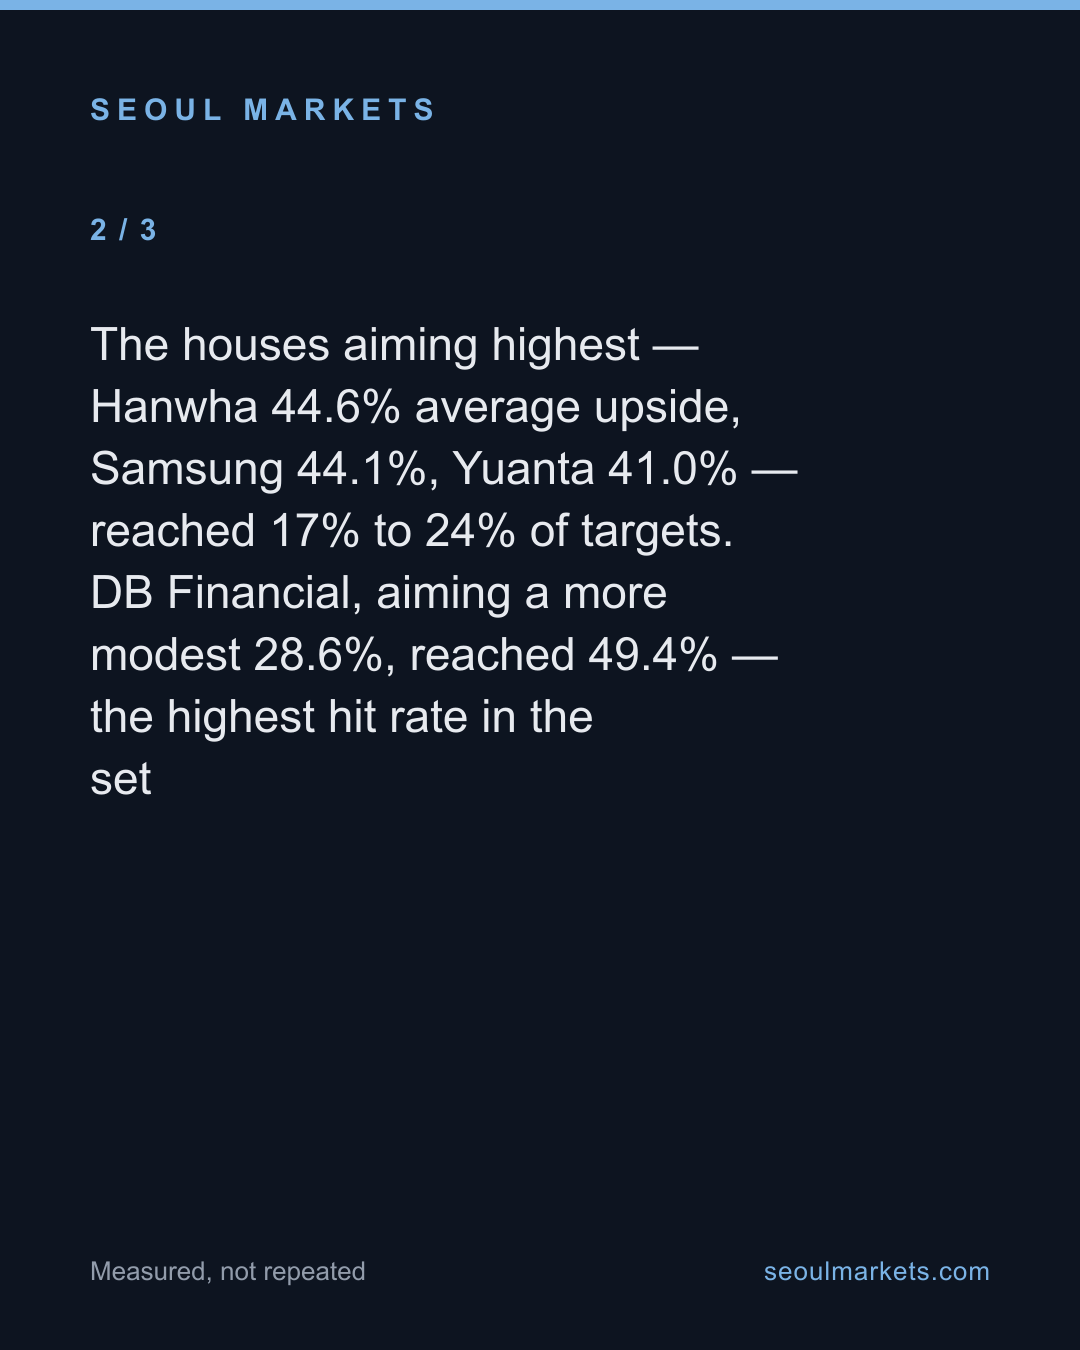
- The houses aiming highest — Hanwha 44.6% average upside, Samsung 44.1%, Yuanta 41.0% — reached 17% to 24% of targets. DB Financial, aiming a more modest 28.6%, reached 49.4% — the highest hit rate in the set
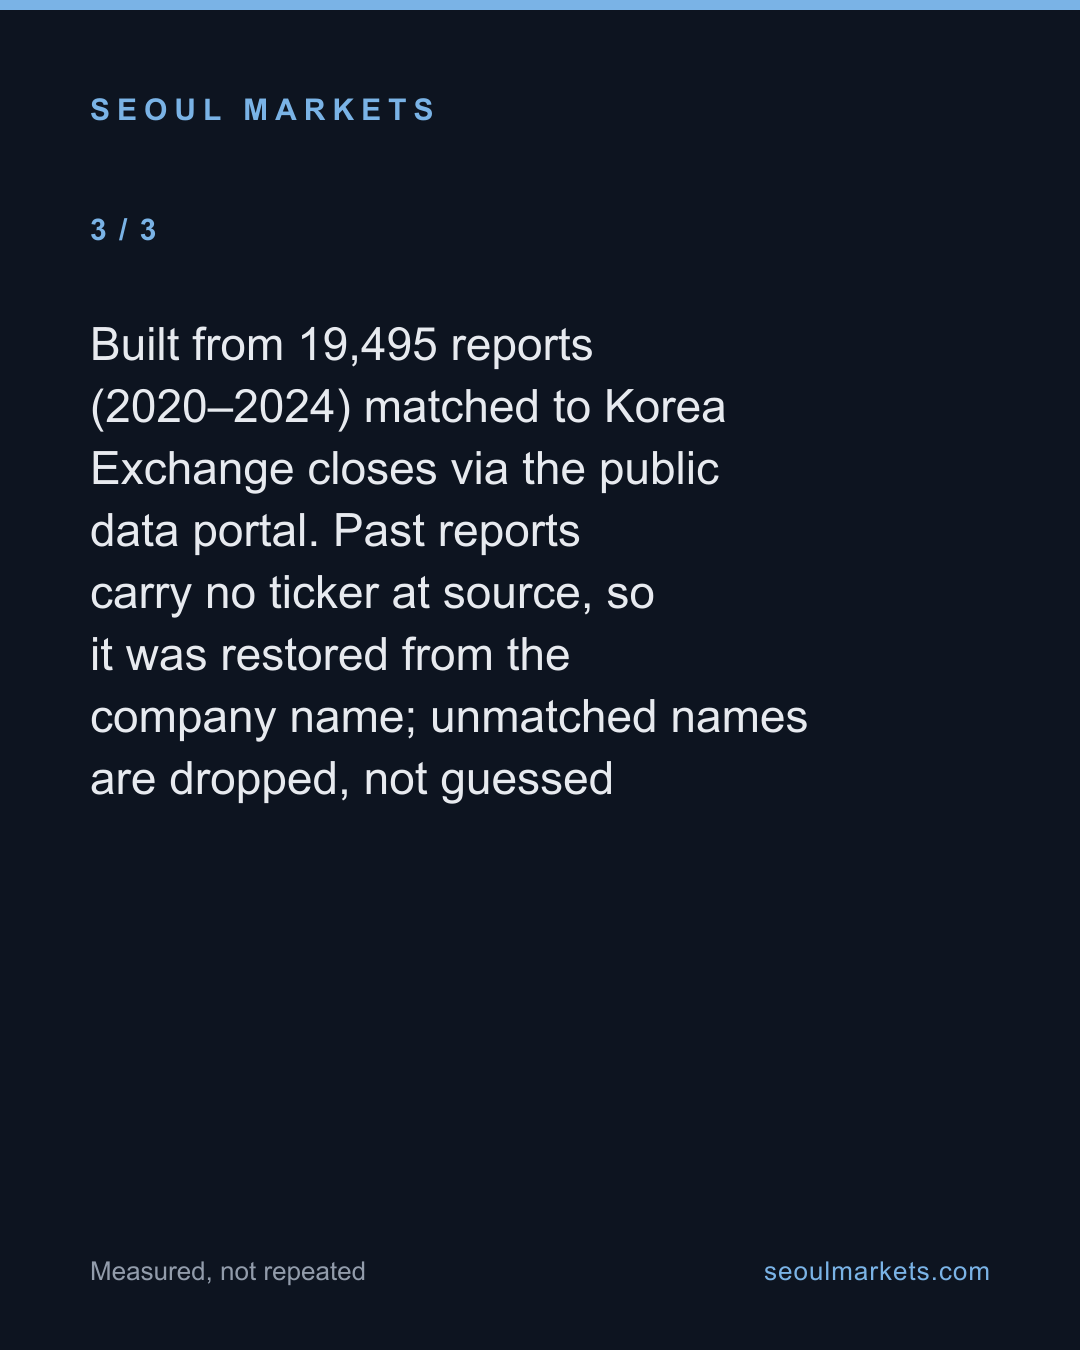
- Built from 19,495 reports (2020–2024) matched to Korea Exchange closes via the public data portal. Past reports carry no ticker at source, so it was restored from the company name; unmatched names are dropped, not guessed
- Excluded figures
- Delisted and renamed tickers that could not be matched to a price. Their removal lifts every hit rate, so the levels are ceilings; the inverse relationship between ambition and accuracy is what survives
- Houses with fewer than 100 scored reports, so no point on the correlation rests on a thin sample
- Any claim that a low target is better analysis. A conservative target can be right for the wrong reason; this measures calibration, not skill
- Overstating the −0.46 as settled: across 18 houses that is t = −2.08 (df 16), just short of the conventional two-tailed 0.05 cutoff (critical t = 2.12). The direction is consistent with the individual comparisons in the table, which each rest on hundreds of reports per house, but the 18-point correlation itself is suggestive rather than proven
The full dataset behind these figures — every listed company, every row — is available to license. SeoulMarkets data for licence →
Not investment advice. SMarkets publishes data journalism for general information only. Nothing here is investment advice, a recommendation, or an offer to buy or sell any security — any investment you make is at your own risk and responsibility. Figures are derived from official public data sources and may be revised by the issuing agency. Verify independently before acting.
Take this away — 5 cards
The figures in this article, as images. Free to repost with the address on them.