Korea sells to and buys from different countries
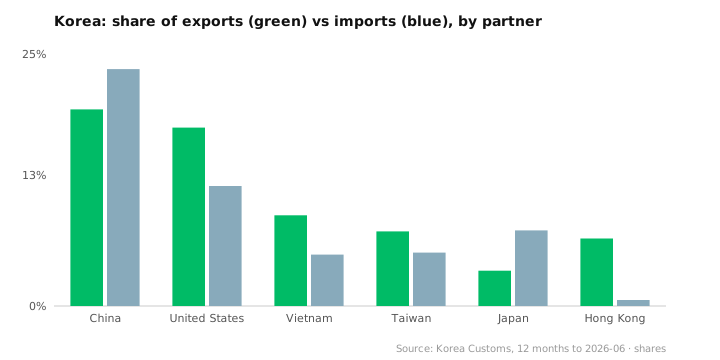
Korea's export map and import map don't match. Hong Kong is 6.7% of exports but 0.6% of imports; Japan is 7.5% of imports but 3.5% of exports.
AI-assisted, human-reviewed sourcing. Figures are pulled programmatically from the official sources listed at the end of this article and checked by an editor before publication.
korea tradeexportsimportstrade partnersmacro
A country’s biggest customers and its biggest suppliers are usually assumed to be roughly the same places. For Korea they are not. The list of countries Korea sells to and the list it buys from overlap at the top — and then diverge sharply.
The two maps do not match
| Partner | Share of exports | Share of imports |
|---|---|---|
| China | 19.5% | 23.5% |
| United States | 17.7% | 11.9% |
| Vietnam | 9.0% | 5.1% |
| Taiwan | 7.4% | 5.3% |
| Japan | 3.5% | 7.5% |
| Hong Kong | 6.7% | 0.6% |
Two partners tell the story. Hong Kong takes 6.7% of everything Korea exports — its fifth-largest export market — but supplies just 0.6% of imports. Korea sells there and barely buys; Hong Kong is a pass-through port more than a source of goods. Japan is the mirror image: it supplies 7.5% of Korea’s imports, its third-largest source, but takes only 3.5% of exports. Korea buys far more from Japan than it sells back.
Even the giants tilt. Both maps are led by China, but Korea imports more from it (23.5%) than it exports to it (19.5%). The United States runs the other way — 17.7% of exports against 11.9% of imports, a market Korea sells into more than it sources from.
Reading it honestly
This is deliberately a map of shares, not dollars. Korea’s monthly trade totals in dollars have an unexplained jump from early 2026, so absolute amounts and a headline surplus are unreliable; shares are not, and they let the two maps sit side by side. We also leave out the very largest rank gaps — places like Bermuda and the Marshall Islands — because those are ship-registry flags of convenience, not real trade.
What is left is a clean and slightly counter-intuitive fact: Korea’s selling map and buying map are not the same map. It sells to Hong Kong and the United States more than it buys from them, and buys from Japan more than it sells there. For the fuller partner picture, see Korea’s trade, partner by partner and where the surplus really comes from.
Partner shares computed from Korea Customs data, 12 months to June 2026, as each partner’s share of total exports and of total imports. Free to reproduce with attribution — cite as SeoulMarkets (seoulmarkets.com) and link back.
Data & Verification Notes
- Data as of
- Sources
- Korea Customs Service (관세청) — export/import by partner country — 12 months to 2026-06; figures are each partner's share of Korea's total exports and of total imports
- Cross-checks
- Shares, not dollar amounts. Each figure is a partner's percentage of Korea's total exports, or of total imports, over the 12 months to June 2026. Using shares avoids a known break in the monthly dollar totals and lets export and import maps be compared directly
- Export share top five: China 19.5%, United States 17.7%, Vietnam 9.0%, Taiwan 7.4%, Hong Kong 6.7%. Import share top five: China 23.5%, United States 11.9%, Japan 7.5%, Taiwan 5.3%, Vietnam 5.1%
- The divergences: Hong Kong is 6.7% of exports but 0.6% of imports; Japan is 7.5% of imports but 3.5% of exports; the United States is 17.7% of exports against 11.9% of imports
- Excluded figures
- Dollar values and the balance in won or dollars. Korea's monthly trade dollar totals have an unexplained level break from early 2026, so we report shares and ranks only, not absolute amounts or a headline surplus figure
- The largest rank gaps by country. The biggest export-vs-import rank differences belong to places like Bermuda and the Marshall Islands — these are ship-registry flags of convenience, not real trade relationships, and we leave them out rather than present them as meaningful
- Why the maps differ. Re-export hubs, supply chains for parts, and energy sourcing all shape this, and the customs data carries the flows, not the reasons
- This is not investment advice
The full dataset behind these figures — every listed company, every row — is available to license. SeoulMarkets data for licence →
Not investment advice. SMarkets publishes data journalism for general information only. Nothing here is investment advice, a recommendation, or an offer to buy or sell any security — any investment you make is at your own risk and responsibility. Figures are derived from official public data sources and may be revised by the issuing agency. Verify independently before acting.
← More Macro