How much of a Korean company's life does its average worker see? At most two-fifths of it
Long tenure and old firms go together at 0.66 — the tenure ladder is partly an age ladder. Measured against firm age, no sector's workers have stayed even half the company's life; research looks churny only because its firms are young.
AI-assisted, human-reviewed sourcing. Figures are pulled programmatically from the official sources listed at the end of this article and checked by an editor before publication.
human capitalcorporate disclosuretenurecompany ageindustry
The tenure ladder — where Korean industry holds people 16 years and where it hands them back in four — invites a simple reading: some sectors are loyal, others churn. It is half right. Set each industry’s tenure against how old its companies actually are, and a quieter fact appears: long tenure and old firms travel together, and nobody’s workers have stayed even half the company’s life.
The ladder is partly an age ladder
Across the 44 industries big enough to rank, average tenure and average company age correlate at 0.66. The sectors at the top of the tenure ladder are also the ones with the oldest firms: financial services averages 65 years old, motor vehicles 58, and their people have stayed 14 and 16 years. Much of “loyalty,” in other words, is just arithmetic — a 20-year-old company cannot have a 25-year average worker.
So the sharper question is not how long people stay, but how much of the company’s life they see. Divide tenure by firm age and the whole ladder compresses into a narrow band.
| Industry | Avg tenure | Firm age | Tenure ÷ age |
|---|---|---|---|
| Rubber and plastics | 12.9 | 33 | 0.40 |
| Retail trade | 10.9 | 33 | 0.33 |
| Motor vehicles | 16.0 | 58 | 0.27 |
| Electronics & telecom equip. | 12.2 | 48 | 0.25 |
| Financial services | 14.2 | 65 | 0.22 |
| Research and development | 3.8 | 18 | 0.21 |
| Wholesale trade | 9.0 | 47 | 0.19 |
The ratio tops out at 0.40 — rubber and plastics, the stickiest sector relative to its age — and the middle of the pack sits near 0.26. Even in Korea’s most stable listed industries, the average worker has been there roughly a quarter of the company’s life. A firm outlives two or three full turns of its own workforce, however loyal it looks from the tenure figure alone.
What this rescues: the “churny” sectors that are just young
The reframing changes who looks bad. Research and development sits last on the raw tenure ladder at 3.8 years — but its firms average only 18 years old, the youngest of any sector. Its people have stayed 0.21 of the company’s life, the same share as decades-old wholesale and pharmaceutical firms. R&D is not a revolving door; it is a young industry whose companies have not been around long enough for long tenures to exist. Publishing (5.4 years, firm age 23) is the same story. Their low place on the tenure ladder is age, not churn.
And what it exposes: old firms that still cycle people
The ratio cuts the other way too. Financial services holds people 14 years, near the top of the tenure ladder — but its firms are the oldest in Korea, 65 years on average, so its workers have seen only 0.22 of the company’s life, no more than young R&D. A 65-year-old bank that keeps the average worker 14 years is a place people still move through; the long tenure is the firm’s age showing through, not unusual stickiness. Retail, by contrast, keeps people 0.33 of a much shorter firm life — genuinely sticky, for an industry no one thinks of that way.
The number worth keeping
Tenure alone flatters the old and punishes the young. Measured against the life of the company, Korea’s industries converge: the average worker, almost everywhere, sees between a fifth and two-fifths of their employer’s existence. The loyal-versus-churn story survives, but only after you take the company’s own age out of it — which is exactly the step a raw tenure ranking skips.
Data & Verification Notes
- Data as of
- Sources
- Financial Supervisory Service (Korea) — DART Open API — empSttus (average tenure) and company (incorporation date)
- Cross-checks
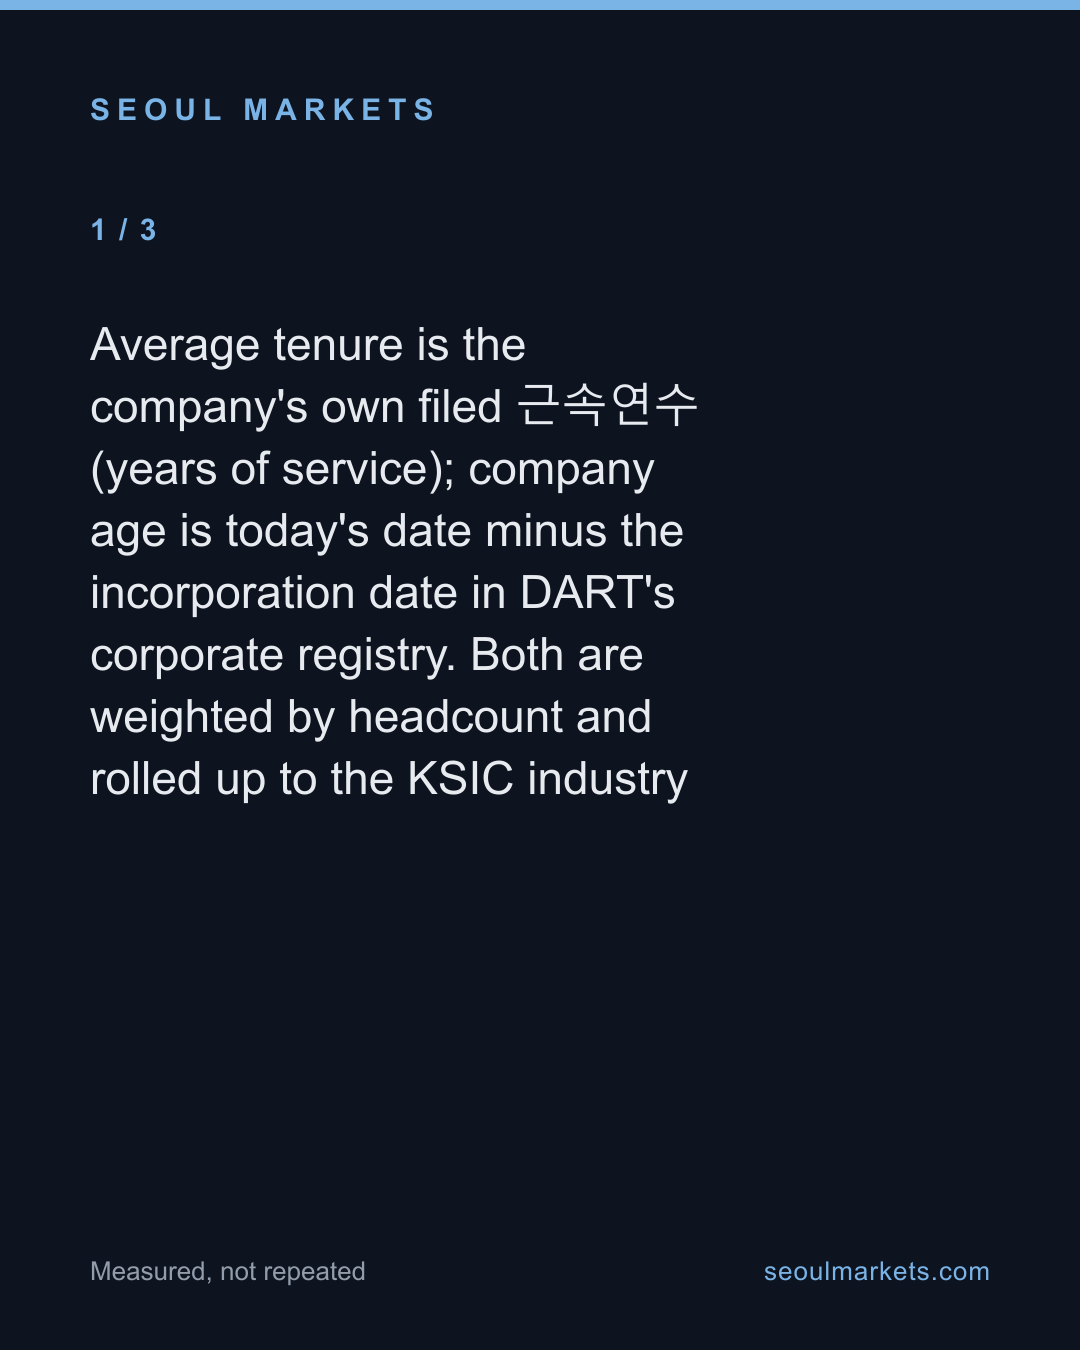
- Average tenure is the company's own filed 근속연수 (years of service); company age is today's date minus the incorporation date in DART's corporate registry. Both are weighted by headcount and rolled up to the KSIC industry
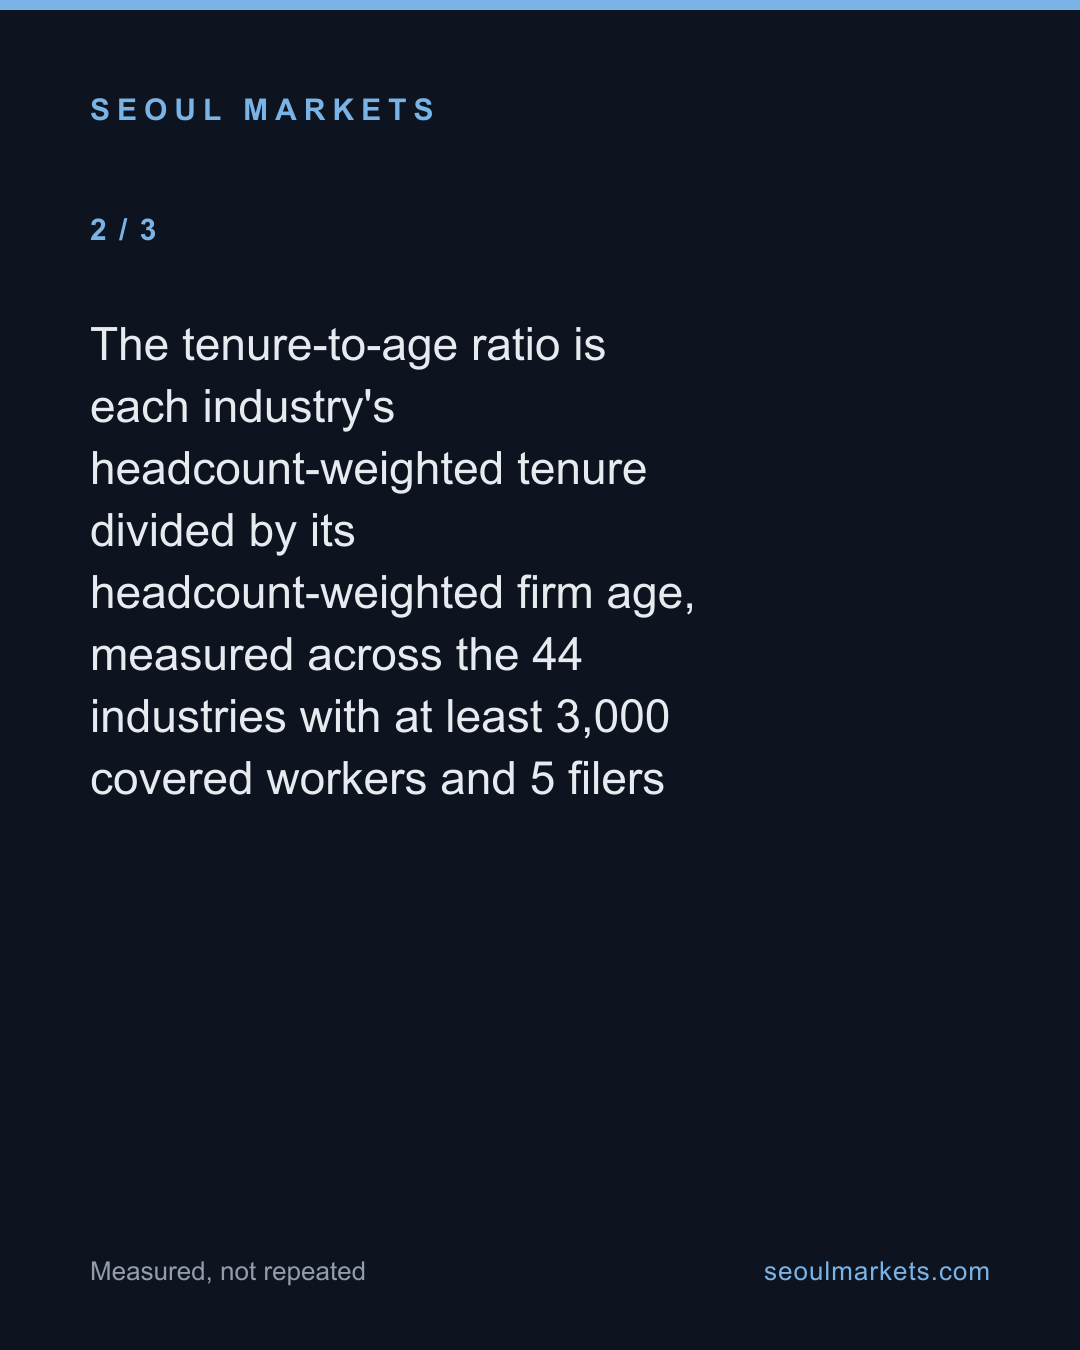
- The tenure-to-age ratio is each industry's headcount-weighted tenure divided by its headcount-weighted firm age, measured across the 44 industries with at least 3,000 covered workers and 5 filers
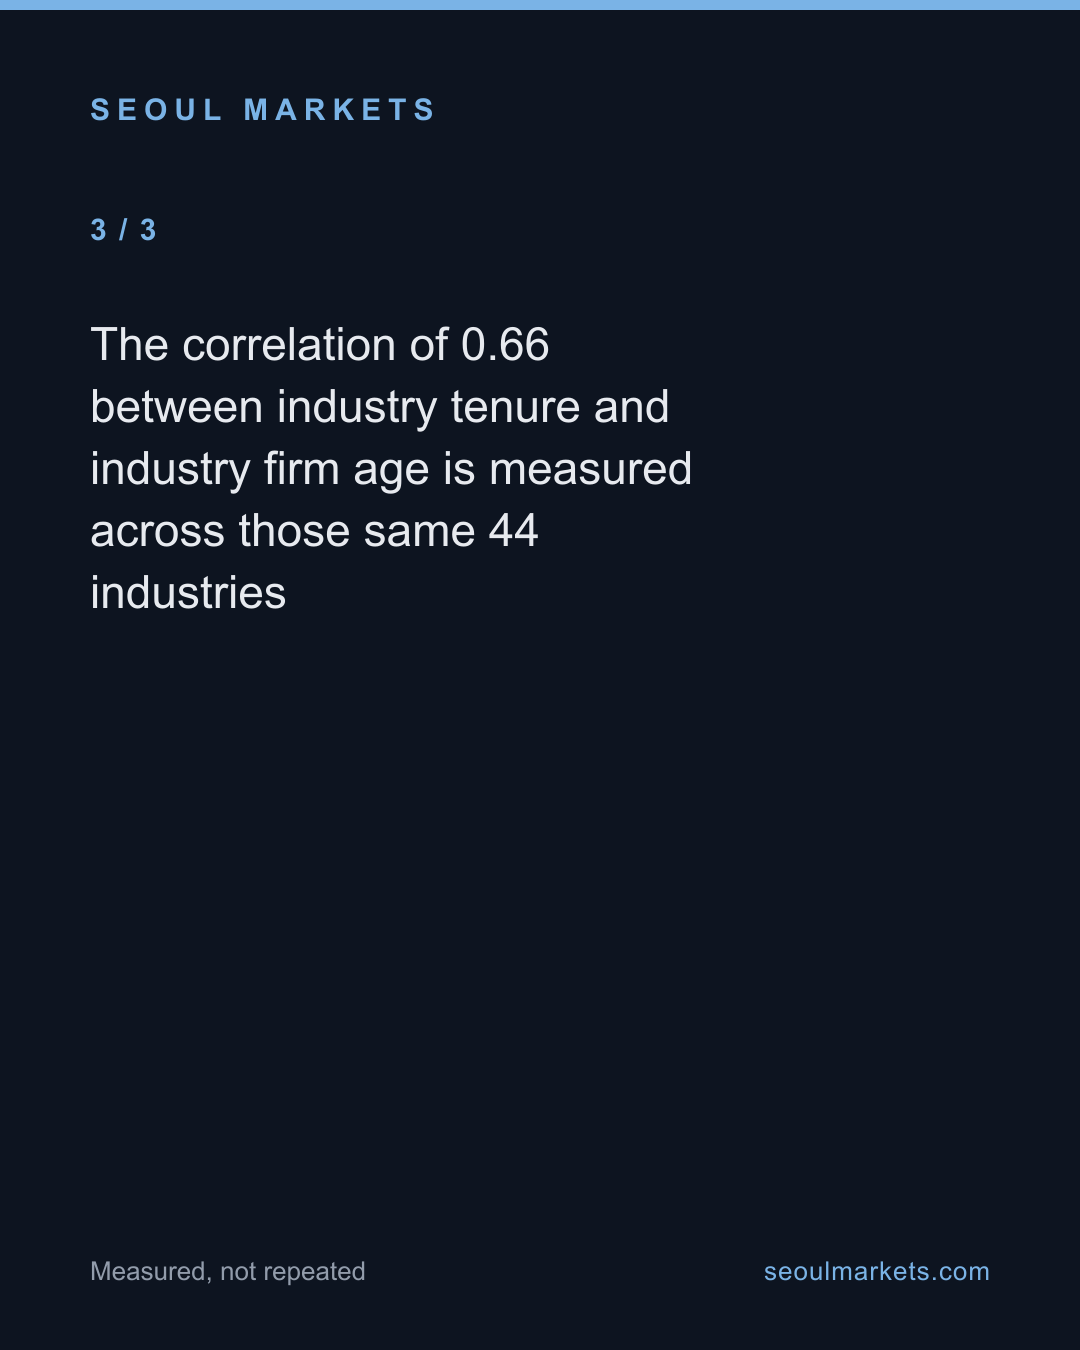
- The correlation of 0.66 between industry tenure and industry firm age is measured across those same 44 industries
- Excluded figures
- Industries below the 3,000-worker, 5-filer bar. Firm age at the extremes swings on a single old or new company, so only well-populated sectors are compared
- Any claim that a company's age caps an individual's tenure. It caps the *average*: a firm incorporated 18 years ago cannot have a 20-year average, but a single re-hired founder can. The ceiling is on the sector mean, which is what is read here
- Post-merger re-incorporation, which resets a firm's registry age below its true operating history and understates age for a handful of restructured firms
The full dataset behind these figures — every listed company, every row — is available to license. SeoulMarkets data for licence →
Not investment advice. SMarkets publishes data journalism for general information only. Nothing here is investment advice, a recommendation, or an offer to buy or sell any security — any investment you make is at your own risk and responsibility. Figures are derived from official public data sources and may be revised by the issuing agency. Verify independently before acting.
Take this away — 5 cards
The figures in this article, as images. Free to repost with the address on them.