Korea's ten biggest trade deficits are oil, gas, and machinery
Rank Korea's biggest trade deficits and nine of the ten sell energy or machines. The tenth sells copper. Oil, gas, and machinery are the import bill.
AI-assisted, human-reviewed sourcing. Figures are pulled programmatically from the official sources listed at the end of this article and checked by an editor before publication.
tradetrade balanceenergyimportskorea
A country’s trade balance has two sides. Korea earns its surplus from a very short list of partners — mainly the United States and China. It pays that surplus back out to a different, longer list. And the paying-out side has a strikingly simple shape.
Nine of the ten are energy or machines
Rank Korea’s trade partners by deficit over the twelve months to June 2026 and the top of the list is almost entirely two things — 9 of 10 sell energy or machines:
| # | Partner | Sells Korea |
|---|---|---|
| 1 | Saudi Arabia | oil |
| 2 | Japan | machinery, parts |
| 3 | Australia | gas, coal, iron ore |
| 4 | Germany | machinery, cars, equipment |
| 5 | UAE | oil, gas |
| 6 | Iraq | oil |
| 7 | Qatar | gas |
| 8 | Kuwait | oil |
| 9 | Algeria | oil, gas |
| 10 | Chile | copper |
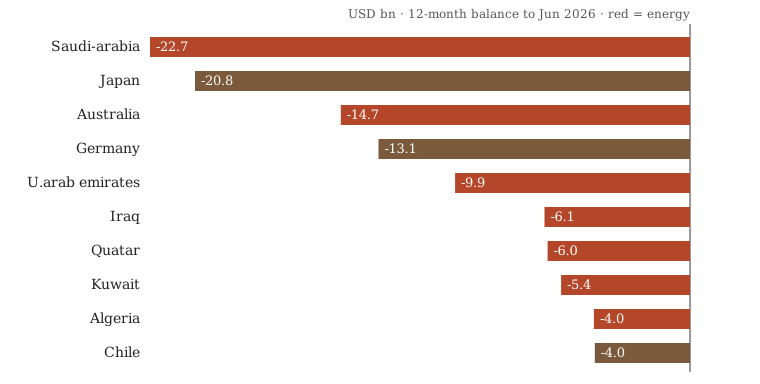
Eight of the ten are energy — oil, gas and coal. Two are machines: Japan and Germany, which sell Korea high-end equipment, parts and cars. The tenth is Chile, which sells copper. Oil, gas, machines, metal. That is the import bill.
Why the ranking, not the dollars
We are deliberately publishing the order and the composition, not the exact deficit in dollars. The reason is in the data: the monthly customs totals contain a scale break from March 2026, so the absolute figures after that month read too high, and we will not print a number we cannot stand behind. What survives the break is what matters here — the ranking is the same whether you measure it over the clean months before March or over the full year, and the composition (energy and machines) does not move at all. That is a real finding; a precise dollar deficit is not.
Why it looks like this
Korea makes very little of its own oil or gas, so energy has to be bought abroad — and it is bought from whoever has it, which is why the deficit league table reads like a map of the world’s oil and gas fields. The machinery deficits with Japan and Germany are the other structural piece: some high-end capital equipment is still imported rather than made at home.
Put the two sides together and the shape of Korean trade is clear. It sells finished goods — chips, cars, ships — to two giants, and buys raw energy and a few machines from a long tail of everyone else. The surplus is manufacturing; the deficit is the fuel and tools that manufacturing runs on. The monthly country data is free to reproduce with credit.
Not investment advice — monthly customs values from official Korean data, ranked rather than levelled because of a known scale break.
Data & Verification Notes
- Data as of
- Sources
- Korea Customs Service (via KOSIS, Statistics Korea) — Exports and imports by partner country, monthly, July 2025–June 2026 (table DT_1R11006_FRM101 / 360)
- Cross-checks
- The ranking is stable across the data's March 2026 scale break: the top four deficits — Saudi Arabia, Japan, Australia, Germany — are the top four whether measured over the trustworthy pre-break months alone or over the full twelve, so the ordering is a real finding even though the exact dollar levels are not
- Of the ten biggest deficits, eight partners are energy exporters — Saudi Arabia, Australia, UAE, Iraq, Qatar, Kuwait, Algeria (oil, gas, coal) — and two are machinery (Japan, Germany); the tenth, Chile, sells copper
- Korea ran a goods deficit with 84 partner countries over the twelve months; it runs its surpluses with a very short list, mainly the US and China
- The pattern is structural: Korea has almost no domestic oil or gas, so energy is bought abroad, and the deficit rises and falls mostly with fuel prices and volumes, not with policy
- Excluded figures
- Exact dollar levels. These are nominal customs values in US dollars, and the underlying monthly totals contain a scale break from March 2026 — absolute levels after that month read too high. We therefore report the ranking and the composition, which survive the break, not the precise deficit figures
- Product detail (what exactly is imported) is not in this partner-country table; energy/machinery is inferred from each partner's known export mix, not from an HS-code breakdown
- Why a partner sells what it sells, and whether these deficits are a problem — a deficit with an oil state is what buying oil looks like, not a failure
- This is not investment advice
The full dataset behind these figures — every listed company, every row — is available to license. SeoulMarkets data for licence →
Not investment advice. SMarkets publishes data journalism for general information only. Nothing here is investment advice, a recommendation, or an offer to buy or sell any security — any investment you make is at your own risk and responsibility. Figures are derived from official public data sources and may be revised by the issuing agency. Verify independently before acting.
← More FX