Korea's temp workers earn 39% of what regular staff make
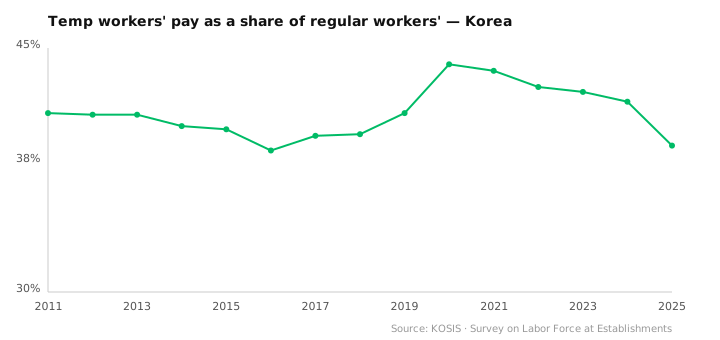
A temp or daily worker's monthly pay has held near 40% of a regular employee's since 2011 — 1.74m won against 4.47m in 2025. It has barely moved.
AI-assisted, human-reviewed sourcing. Figures are pulled programmatically from the official sources listed at the end of this article and checked by an editor before publication.
korea wagestemporary workersinequalitylabourmacro
There are two pay worlds inside the same Korean labour market, and the distance between them has hardly changed in fourteen years. A regular employee took home an average of 4.47m won a month in 2025. A temporary or daily worker took home 1.74m — about 39% of the regular figure.
A 40% ratio that will not move
| Year | Regular pay | Temp/daily pay | Temp ÷ regular |
|---|---|---|---|
| 2011 | 2.81m won | 1.15m won | 41% |
| 2016 | 3.33m won | 1.29m won | 38.7% |
| 2020 | 3.72m won | 1.64m won | 44% |
| 2025 | 4.47m won | 1.74m won | 39% |
For fourteen years the ratio has sat in a tight band — between about 39% and 44%. It started at 41% in 2011 and ended at 39% in 2025. Both kinds of pay rose over the period, but they rose together, keeping the proportion roughly fixed. The one wobble is 2020: the ratio climbed to 44%, and not for a good reason — regular pay stalled that year while temporary pay was still rising, which narrows the gap on paper without the lower-paid group actually catching up.
Read this number carefully
The honest caveat matters here. This is total monthly pay, not an hourly wage. Temporary and daily workers often work fewer hours, so part of the 40% gap is simply fewer hours on the clock, not only a lower rate per hour. A pure hourly comparison would be narrower — this data does not separate hours from rate, and we will not guess the split.
What the figure does show, cleanly, is the shape of the divide as workers actually experience it in a monthly pay packet: a temporary or daily worker in Korea brings home roughly two-fifths of what a regular employee does, and that ratio has barely moved since 2011. It sits alongside the other lines of the same market — pay also rises with firm size at every step, and overall real wages went flat after 2021.
Regular and temporary pay computed from KOSIS: Ministry of Employment and Labor establishment survey, total monthly earnings per worker, annual averages. Free to reproduce with attribution — cite as SeoulMarkets (seoulmarkets.com) and link back.
Data & Verification Notes
- Data as of
- Sources
- Statistics Korea (KOSIS) — Ministry of Employment and Labor «Survey on Labor Force at Establishments» (사업체노동력조사) — KOSIS 118/DT_118N_MON041·051·054 — item MD_13 (regular-worker total earnings) and MD_17 (temporary/daily total earnings), per worker, monthly, all industries
- Cross-checks
- Monthly total earnings per worker: regular employees (상용) versus temporary and daily workers (임시일용), all industries, establishments with one or more regular employees, full calendar years. Ratio = temporary ÷ regular
- In 2025 regular-worker pay averaged 4.47m won a month and temporary/daily pay 1.74m — a ratio of 39%. Across 2011–2025 the ratio stayed in a narrow 38.7%–44% band; it was 41% in 2011 and 39% in 2025
- The one visible move is 2020, when the ratio rose to 44% — not because temporary pay jumped, but because regular pay stalled that year; temporary pay kept rising into 2022 and then fell back
- Excluded figures
- This is total monthly pay, not an hourly wage. Temporary and daily workers often work fewer hours, so part of this 40% gap is fewer hours worked, not only a lower hourly rate. A pure hourly-wage gap would be narrower; this figure does not separate the two, and we do not estimate the split
- Who is in the category. «Temporary and daily» is a mix — short-term contracts, day labour, part-time — and its composition shifts over time. The average hides that spread
- Why the gap persists. Contract type, industry, hours and bargaining all sit behind it; the series carries the pay, not the cause
- This is not investment advice
The full dataset behind these figures — every listed company, every row — is available to license. SeoulMarkets data for licence →
Not investment advice. SMarkets publishes data journalism for general information only. Nothing here is investment advice, a recommendation, or an offer to buy or sell any security — any investment you make is at your own risk and responsibility. Figures are derived from official public data sources and may be revised by the issuing agency. Verify independently before acting.
← More Macro