Korea's real wages climbed for a decade, then went flat
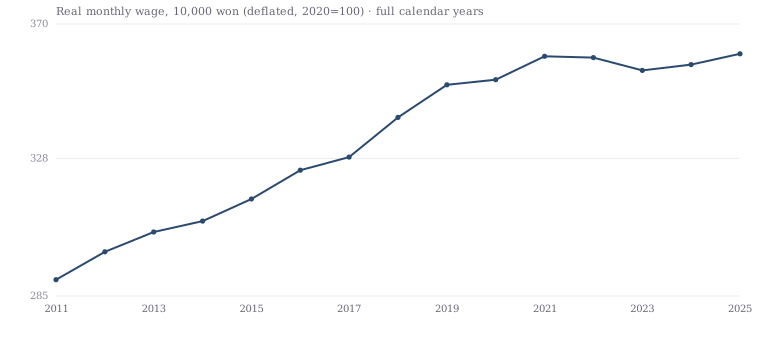
Korea's real monthly wage rose ~24% from 2011 to 2021 — then stalled. In the four years since, it is up just 0.2%. The 2020s look nothing like the 2010s.
AI-assisted, human-reviewed sourcing. Figures are pulled programmatically from the official sources listed at the end of this article and checked by an editor before publication.
korea wagesreal wageslabourinflationmacro
For most of the 2010s, a Korean worker’s pay kept ahead of prices. Adjusted for inflation, the average monthly wage rose almost every year — from 2.90m won in 2011 to 3.60m in 2021, a 24% gain in real terms over a decade. Then it stopped.
A decade of gains, then four flat years
| Period | Real monthly wage | Change |
|---|---|---|
| 2011 | 2.90m won | — |
| 2016 | 3.24m won | +11.8% (5yr) |
| 2021 | 3.60m won | +24.1% (from 2011) |
| 2025 | 3.61m won | +0.2% (from 2021) |
The two halves of that table are different economies. From 2011 to 2021, real pay compounded at roughly 2–3% a year. From 2021 to 2025 it moved 0.2% in total — not per year, in total. A worker whose real wage tracked the average has, in inflation-adjusted terms, earned the same for four years running.
Flat, not smooth
The plateau is not a straight line. Real wages actually fell in two of the four years — −0.1% in 2022 and −1.1% in 2023, the sharpest annual real decline in this series — before recovering +0.5% in 2024 and +0.9% in 2025. The net across the four years is essentially zero. Prices rose fast enough in 2022–2023 to eat the raises; the last two years clawed the loss back and no more.
Why we are not quoting you a monthly number
The figure that makes headlines is the monthly one — Korea’s labour ministry reported that June’s real wage was 3.412m won, down 0.1% on the year and negative for a third straight month. We are deliberately not building on that here, for two honest reasons.
First, monthly real-wage figures swing wildly, and not because pay does. Bonuses land in specific months — a big December, a big January — so any single month is dominated by whether a bonus fell inside it. In fact bonuses are about an eighth of Korean pay and cluster into just a few months. Comparing one month to the next, or even one month to the same month a year earlier, mostly measures bonus timing. Full-year averages cancel that; single months do not.
Second, June is not yet in the public data. The ministry’s press release is ahead of the KOSIS table it comes from, and we report what we can pull and recompute ourselves, not what a release says. When June posts, it will be one data point inside a plateau that the annual figures already show clearly.
The annual picture is the honest one, and it is stark enough on its own: the long climb in Korean real wages ended around 2021, and four years on it has not resumed.
This is the national average. Where that average lands depends on where you work: pay rises with firm size at every step, and temporary workers earn about 40% of what regular staff make, and a sector’s biggest firms pay more than its smaller ones. It also depends on getting in the door at all — youth unemployment has fallen from its mid-2010s peak, though not everyone who left the jobless count found work. And the flat pay came even as hours worked kept falling — about an eighth fewer since 2011.
Real wages computed from KOSIS: Ministry of Employment and Labor establishment-survey earnings, deflated by Statistics Korea’s CPI (2020=100). Free to reproduce with attribution — cite as SeoulMarkets (seoulmarkets.com) and link back.
Related — where this shows up
- Taxes and transfers nearly halve Korea’s income gap — flat wages are the market side; redistribution is what moves the disposable gap.
- Korea’s small merchants haven’t felt neutral in years — how the economy underneath flat wages actually feels, month to month.
Data & Verification Notes
- Data as of
- Sources
- Statistics Korea (KOSIS) — Ministry of Employment and Labor «Survey on Labor Force at Establishments» (nominal wages) + Statistics Korea CPI (deflator) — KOSIS 118/DT_118N_MON041·MON051·MON054 (nominal monthly earnings) deflated by 101/DT_1J22003 (CPI, 2020=100)
- Cross-checks
- Real wage = nominal total monthly earnings per worker ÷ (CPI ÷ 100), CPI base 2020=100; scope is all industries, establishments with one or more regular employees, average per worker. This is the same construction Korea's labour ministry uses for its real-wage figure
- Full calendar years only are compared. 2011 averaged 2.90m won and 2021 averaged 3.60m — a 24.1% real rise. 2021 to 2025 moved 3.599m to 3.607m: +0.2% across four years, versus roughly +24% across the decade before
- The four flat years are not flat month to month: 2022 was −0.1%, 2023 −1.1%, 2024 +0.5%, 2025 +0.9%. The net over the four is essentially zero
- Excluded figures
- Monthly figures. Single months swing violently because bonuses (특별급여) land in particular months — December and February spike, others sag — so a single month or a one-month year-on-year change is noise, not signal. We use full-year averages, which cancel the bonus timing
- 2026 so far. Only January–May are in the data, and those months are bonus-heavy, so the partial-year average is not comparable to a full year and is left out of the trend. The labour ministry's June figure (reported 27 July: 3.412m won, −0.1% year on year, a third straight monthly decline) is not yet posted to KOSIS, so we do not treat it as confirmed here
- Why wages stalled. This series carries pay and prices, not causes — productivity, hours, industry mix and bargaining are elsewhere, and we will not infer them from a wage line
- This is not investment advice
The full dataset behind these figures — every listed company, every row — is available to license. SeoulMarkets data for licence →
Not investment advice. SMarkets publishes data journalism for general information only. Nothing here is investment advice, a recommendation, or an offer to buy or sell any security — any investment you make is at your own risk and responsibility. Figures are derived from official public data sources and may be revised by the issuing agency. Verify independently before acting.
← More Macro