Koreans now work 13% fewer hours than in 2011
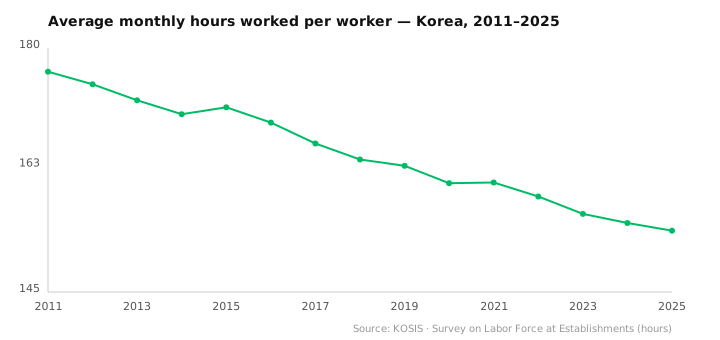
The average worker's monthly hours fell from 176.6 in 2011 to 153.8 in 2025 — a steady 13% drop, measured on Korea's own establishment survey.
AI-assisted, human-reviewed sourcing. Figures are pulled programmatically from the official sources listed at the end of this article and checked by an editor before publication.
korea working hoursworking hourslabouroverworkmacro
Korea’s reputation is for long hours. The reputation is earned, but the trend runs the other way: on the country’s own establishment survey, the average worker put in 176.6 hours a month in 2011 and 153.8 in 2025 — a 12.9% fall over fourteen years, and it happened almost year by year.
Down every year, not in one jump
| Year | Hours / month | Annualised |
|---|---|---|
| 2011 | 176.6 | ~2,119 |
| 2015 | 171.5 | ~2,058 |
| 2019 | 163.1 | ~1,957 |
| 2022 | 158.7 | ~1,904 |
| 2025 | 153.8 | ~1,846 |
The line barely pauses. Each year from 2011 to 2025 sits at or below the year before it — there is no reversal, only a slowing near the end. In fourteen years the average month lost about 23 hours of work, roughly three full working days a year that used to be worked and now are not.
Why the number looks different from the one you may have seen
Two honest caveats sit around this figure, and both matter.
First, this is the establishment survey — hours reported by employers for workers at firms with a regular payroll, averaged per worker. It is not the OECD’s annual-hours series, which uses a different scope and method and comes out lower. Both are real; they measure slightly different things. We quote the survey we can pull and recompute ourselves, and we do not splice the two together.
Second, the monthly numbers are calendar-driven. A short February with the Lunar New Year inside it reads near 132 hours; a long July reads near 168. That swing is the calendar, not a change in how hard anyone works. Comparing one month to the next mostly measures which holidays fell where. Full-year averages remove that, which is why every number here is an annual one.
What the annual series does say, cleanly, is this: the amount of time a Korean worker spends working has fallen by about an eighth since 2011, steadily, and had not stopped falling as of 2025.
Fewer hours, flat pay
The hours came down — and recorded overtime fell even faster, by about a third. Most of the drop is fewer working days, not shorter ones. Pay, adjusted for inflation, did not keep climbing to match: real wages rose for a decade and then went flat after 2021. Where a worker lands on both counts depends on where they work — bigger firms pay more at every step — and on getting hired at all, where youth unemployment has fallen from its mid-2010s peak even as more young people step outside the count.
Working hours computed from KOSIS: Ministry of Employment and Labor establishment survey, total hours worked per worker, annual averages of monthly figures. Free to reproduce with attribution — cite as SeoulMarkets (seoulmarkets.com) and link back.
Data & Verification Notes
- Data as of
- Sources
- Statistics Korea (KOSIS) — Ministry of Employment and Labor «Survey on Labor Force at Establishments» (사업체노동력조사) — KOSIS 118/DT_118N_MON041·MON051·MON054, item 13103110311MD_7 (total hours worked per worker, monthly), all industries, all sizes
- Cross-checks
- Total hours worked per worker per month (regular plus temporary/daily), all industries, establishments with one or more regular employees. Three table IDs are stitched across two industry-classification revisions (9th 2011–2019, 10th 2020–2025, 11th 2026–). At both seams the month-on-month change was small — −4.3% at 2019-12→2020-01 and −3.2% at 2025-12→2026-01, both inside ordinary monthly swings, so the join does not create the trend
- Full calendar years only. The annual average of monthly hours fell from 176.6 in 2011 to 153.8 in 2025 — a 12.9% decline. Annualised (×12) that is roughly 2,119 hours in 2011 and 1,846 in 2025
- The fall is steady, not a single step: every year from 2011 to 2025 is at or below the one before it, with the largest single-year drops around 2017 and 2023
- Excluded figures
- Why hours fell. This series carries hours worked, not the reasons for them — statutory limits, industry mix, part-time share and demand are all elsewhere, and we will not infer them from an hours line
- OECD annual-hours comparisons. The OECD's headline figure for Korea uses a different scope and method and lands lower; mixing the two would compare unlike things. We report only the establishment-survey number and label it as such
- Monthly figures. Single months swing hard on working days and holidays — February (short, with the Lunar New Year) routinely reads near 132 hours while a full July reads near 168 — so a single month is calendar noise. Full-year averages cancel it
- 2026 so far. Only January–May are posted, so the partial-year average is not comparable to a full year and is left out of the trend
- This is not investment advice
The full dataset behind these figures — every listed company, every row — is available to license. SeoulMarkets data for licence →
Not investment advice. SMarkets publishes data journalism for general information only. Nothing here is investment advice, a recommendation, or an offer to buy or sell any security — any investment you make is at your own risk and responsibility. Figures are derived from official public data sources and may be revised by the issuing agency. Verify independently before acting.
← More Macro